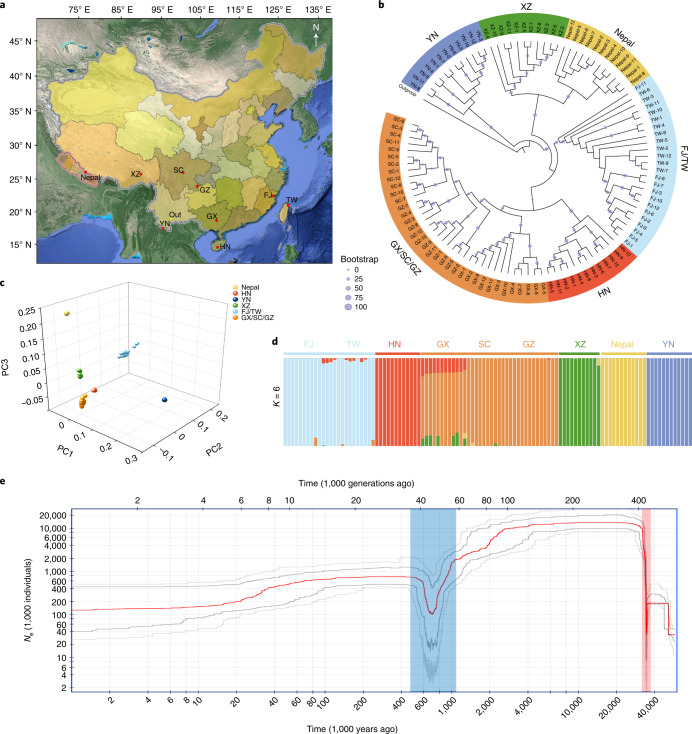
Fig. 4. Phylogenetic relationships and structure of A. spinulosa populations.
a, Geographic distribution of 107 A. spinulosa individuals in nine locations, including Yunnan (YN), Nepal, Xizang (XZ), Fujian (FJ), Taiwan (TW), Hainan (HN), Guangxi (GX), Sichuan (SC) and Guizhou (GZ), with A. costularis in YN as an outgroup (Out). b, A phylogenetic tree of 107 accessions constructed using the whole-genome SNPs. All accessions were clustered into six groups: YN, XZ, Nepal, FJ/TW, HN and GX/SC/GZ. The sizes of the dots on the nodes are proportional to bootstrap support values. c, PCA, with the proportion of the variance explained being 85.8% for PC1, 13.2% for PC2 and 12.4% for PC3. The dots are coloured corresponding to the colours in b. d, Cross-validation error shows that K = 6 is the optimal population clustering group. The structures are coloured corresponding to the colours used in b. e, Demographic history of A. spinulosa. The stairway plot shows the historical effective population size Ne (y axis) with a generation time of 100 years. The blue and red shadows represent two bottlenecks. The red line represents median of effective population size based on a subset of 200 inferences. Dark gray and light gray lines represent 75% and 95% confidence intervals, respectively.

