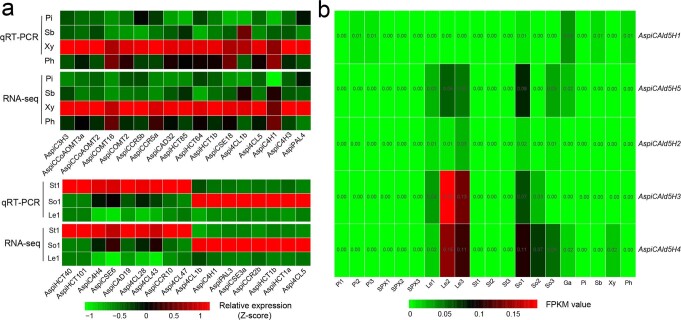
Extended Data Fig. 5. Expression patterns of monolignol biosynthetic genes in different tissues of A. spinulosa.
(a) The first heat map shows FPKM values of 17 monolignol biosynthetic genes in pith (Pi), sclerenchymatic belt (Sb), xylem (Xy), and phloem (Ph) by RNA-seq analysis and their transcript abundance by qRT-PCR analysis. The second heat map shows FPKM values of 17 monolignol biosynthetic genes in St1 (stem stage 1), So1 (sorus stage 1), Le1 (leaf stage 1) by RNA-seq analysis and their transcript abundance by qRT-PCR analysis. Transcript abundance and FPKM values were normalized using the Z-score method. (b) Heat map shows FPKM values of five CAld5H genes in different tissues of A. spinulosa. Pi1/2/3 (pith stage 1/2/3), SPX1/2/3 (wavy structure stage 1/2/3), So1/2/3 (sorus stage 1/2/3), St1/2/3 (stem stage 1/2/3), Le1/2/3 (leaf stage 1/2/3), Ga (gametophyte). All gene accession numbers are shown in Supplementary Data 3.

