. 2021 Dec 13;82(3):377–390. doi: 10.1158/0008-5472.CAN-21-0810

Figure 2.

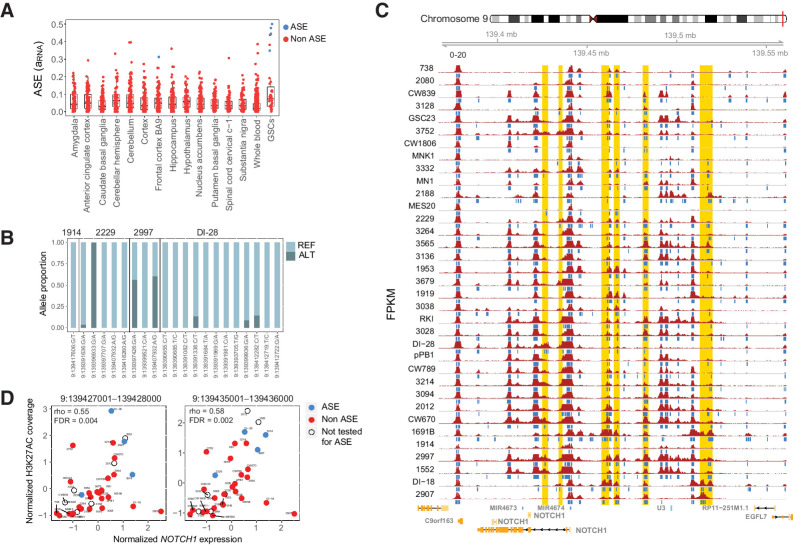
Figure 2. NOTCH1 exhibits recurrent allele-specific expression and association with multiple CREs. A, ASE estimates (aRNA) of NOTCH1 in GSC and normal brain and whole-blood samples from GTEx. B, The proportion of NOTCH1 RNA-seq reads matching the reference and alternate alleles at heterozygous sites in four GSCs with significant NOTCH1 ASE. Reads at these heterozygous variants are used to estimate ASE, but these variants are not necessarily the cause of ASE, which, for example, may be due to unobserved cis-regulatory mutations. C, The H3K27ac profile around NOTCH1. Samples are arranged in increasing order of gene expression, with the highest expression samples at the bottom. Blue bars below each track indicate H3K27ac peaks detected using MACS2. Putative CREs that are correlated with NOTCH1 gene expression (empirical P ≤ 0.05) are highlighted in gold. D, Spearman correlation between H3K27ac and NOTCH1 expression for two putative CREs. Each point is a sample. Samples are blue if they have significant ASE, red if they do not have significant ASE, and uncolored if ASE cannot be estimated (due to absence of a heterozygous variant).

NOTCH1 exhibits recurrent allele-specific expression and association with multiple CREs. A, ASE estimates (aRNA) of NOTCH1 in GSC and normal brain and whole-blood samples from GTEx. B, The proportion of NOTCH1 RNA-seq reads matching the reference and alternate alleles at heterozygous sites in four GSCs with significant NOTCH1 ASE. Reads at these heterozygous variants are used to estimate ASE, but these variants are not necessarily the cause of ASE, which, for example, may be due to unobserved cis-regulatory mutations. C, The H3K27ac profile around NOTCH1. Samples are arranged in increasing order of gene expression, with the highest expression samples at the bottom. Blue bars below each track indicate H3K27ac peaks detected using MACS2. Putative CREs that are correlated with NOTCH1 gene expression (empirical P ≤ 0.05) are highlighted in gold. D, Spearman correlation between H3K27ac and NOTCH1 expression for two putative CREs. Each point is a sample. Samples are blue if they have significant ASE, red if they do not have significant ASE, and uncolored if ASE cannot be estimated (due to absence of a heterozygous variant).