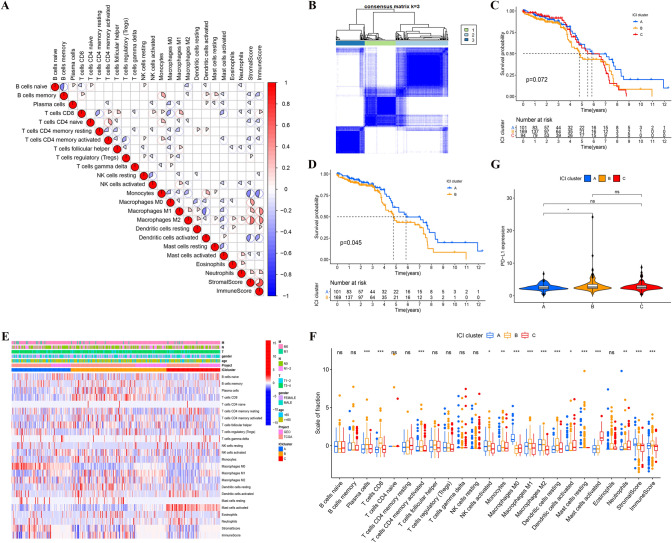
Fig. 1.
A The correlation heat map visualized the universal landscape of immune cell interaction in TME. The correlation coefficient decreased in size from red to blue. B Consensus matrixes of all CC samples for appropriate k value (k = 3), displaying the clustering stability using 1000 iterations of hierarchical clustering. All samples were clustered into 3 subtypes. C Kaplan–Meier curves of overall survival in different ICI clusters. Log rank test showed an overall p = 0.072. D Kaplan–Meier curves of overall survival between ICI cluster A and B. Log rank test showed an overall p = 0.045. E The heat map depicted unsupervised clustering of ICI in all CC samples. Rows represented tumor-infiltrating immune cells, and columns represented samples. F The fraction of tumor-infiltrating immune cells, immune score and stromal score in three ICI clusters. The statistical difference of three ICI clusters was compared by the Kruskal–Wallis test. G The difference of PD-L1 expression among distinct ICI clusters. (*p < 0.05, **p < 0.01, ***p < 0.001, nsp > 0.05)

