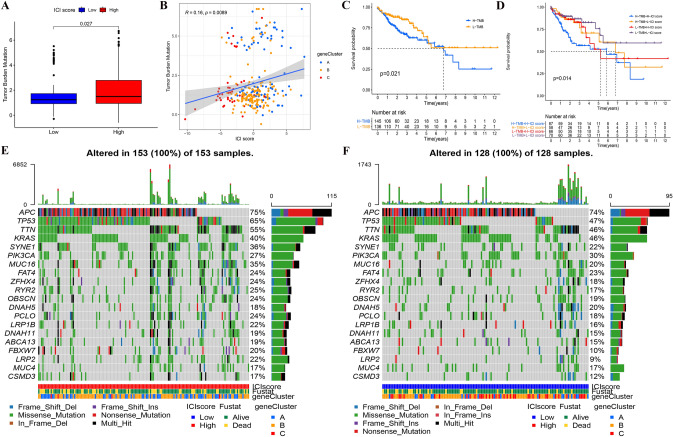
Fig. 6.
A The TMB of HSG was significantly higher than that of LSG. Wilcoxon test, Wilcoxon test, p = 0.027. B The scatterplots depicted the positive correlation between ICI scores and TMB. The Spearman correlation between ICI scores and TMB was 0.16 (p = 0.0089). C Kaplan–Meier curves of overall survival in different TMB subgroups. Log rank test, p = 0.021. D Kaplan–Meier curves of overall survival stratified by both TMB and ICI scores. Log rank test, p = 0.014. E–F The waterfall diagram showed the top 20 driver genes exhibiting the highest mutation frequency in HSG (E) and LSG (F)

