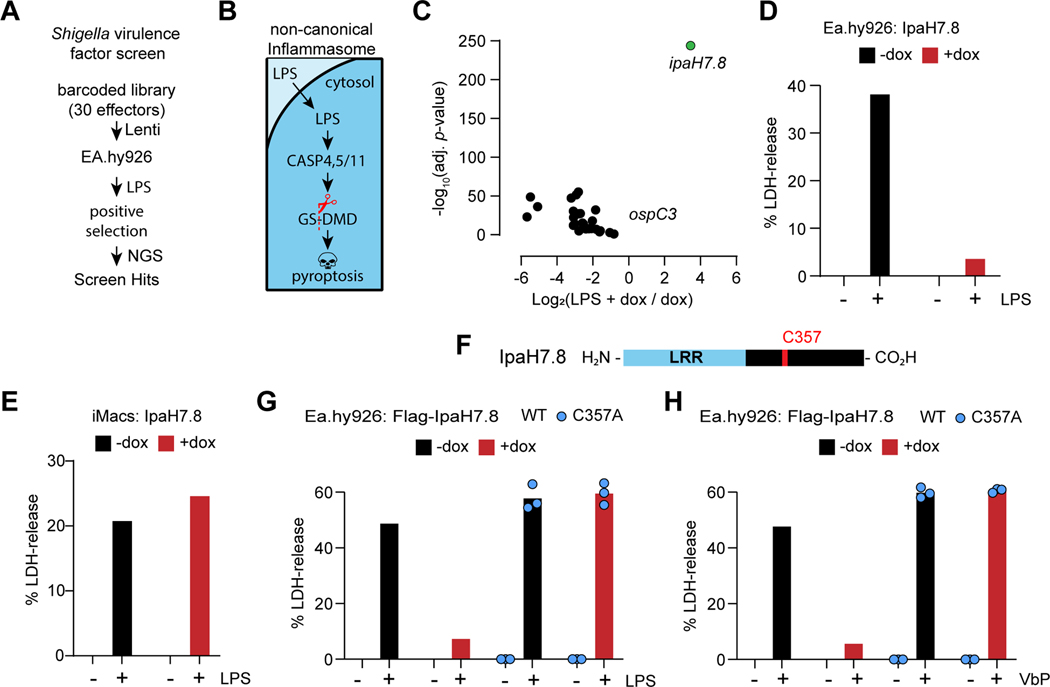
Figure 1. IpaH7.8 ubiquitin ligase activity blocks pyroptosis in human cells.
(A) Shigella effector positive selection screen strategy (NGS, next generation sequencing).
(B) The non-canonical inflammasome pathway.
(C) Volcano plot depicting changes in effector abundance in the LPS- and dox-treated sample relative to the dox-only control. The x-axis corresponds to the Log2 fold change in gene expression, and the y-axis indicates the adjusted p-value. Wald test, FDR adjustment by Benjamini-Hochberg method (n = 3 per group).
(D, E, G and H) Graphs indicate the percentage of LDH released from Ea.hy926 cells (D, G, and H) or iMacs (E) after LPS electroporation (D, E and G) or treatment with 25 μM Valboro-Pro (H, VbP).
(F) Domain architecture of IpaH7.8.
Where indicated, doxycycline (dox) was used to induce expression of wild-type (WT) IpaH7.8 or mutant IpaH7.8(C357A). Bars represent the mean of 3–4 biological replicates, each plotted as a single data point.
See also figure S1.

