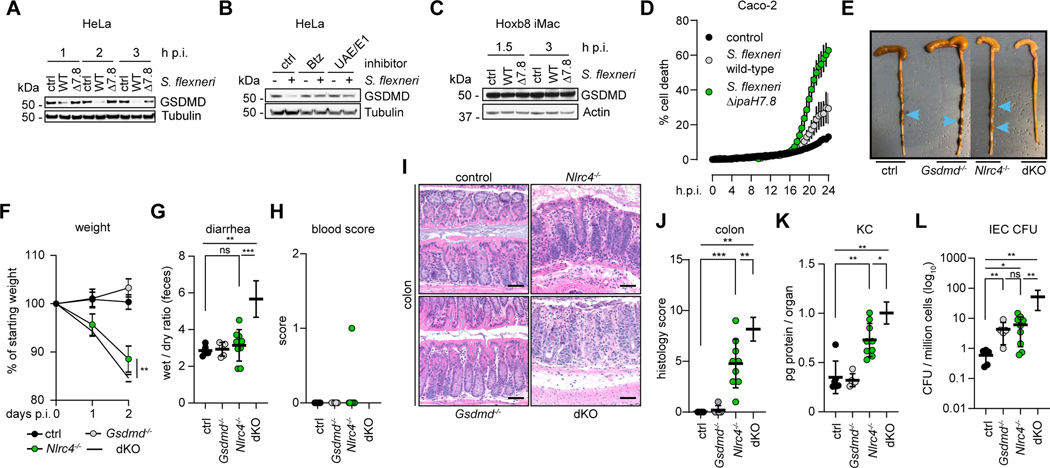
Figure 5. GSDMD restricts S. flexneri replication in Nlrc4−/− mice.
(A) Immunoblots of HeLa cells infected by S. flexneri 5a strain M90T wild-type (WT) or ΔipaH7.8. h.p.i, hours post-infection. Results representative of 3 independent experiments.
(B) Immunoblots of HeLa cells infected with S. flexneri 5a strain M90T for 2 h in the presence of DMSO vehicle or 1 μM Bortezomib (Btz), or MLN-7243 (UAE1). Results representative of 3 independent experiments.
(C) Immunoblots of iMacs infected by S. flexneri 5a strain M90T WT or ΔipaH7.8. Results representative of 3 independent experiments.
(D) Percentage of infected Caco-2 cells killed by GFP-expressing S. flexneri 5a strain M90T wild-type (WT, grey circles), ipaH7.8 deficient (ΔipaH7.8, green circles), or un-infected control (black circles) based on their uptake of propidium iodide (GFP/PI++ cells over total GFP+ cells). Circles represent the mean ± SD calculated from 6 infected wells. Data representative of 3 independent experiments.
(E to L) Characterization of control (black circles, n = 6), Gsdmd−/− (grey circles, n = 5), Nlrc4−/− (green circles, n = 9) and Nlrc4−/−Gsdmd−/−(dKO, white circles, n = 6) female mice at 48 h.p.i. challenged with 107 CFU (colony forming units) of S. flexneri 2a strain 2457T. Endpoint harvests were performed 48 h.p.i. (E) Representative images of cecum and colon. Note the cecum tissue thickening (size reduction), macroscopic edema, and lack of stool pellets (blue arrows) in dKO tissue. (F) Percentage change in body weight. (G) Feces weights before and after dehydration. (H) Fecal blood scores (1 = occult blood, 2 = macroscopic blood). (I) Representative images of H&E stained cecum and colon tissue from infected mice (50 μm scale bar). (J) Blinded quantification of histology score (cumulative) for tissues in I. (K) Tissue KC levels measured by ELISA. (L) CFUs in the IEC-enriched fraction of gentamicin-treated cecum and colon (combined). (G and H, J to L) Each symbol represents one mouse, lines represent mean ± SD. (F) Each symbol represents the mean of all animals within the indicated group ± SD. Mann-Whitney test, * p < 0.05, ** p < 0.01, *** p < 0.001, ns = not significant (p > 0.05).
See also figure S5.

