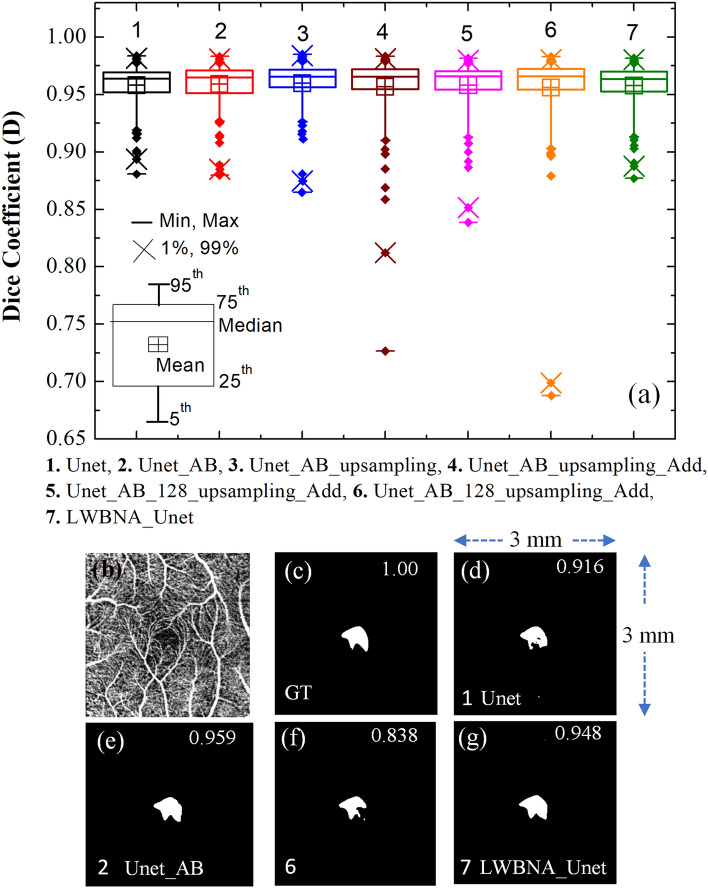
Figure 3.
(a) Boxplot of dice coefficient (D, on a testing dataset of 145 images) obtained from the segmentation of FAZ by different DL models given in Table 1. (b) Relatively a clear OCTA image (3 × 3 mm2) for which most of the DL models gave low D for FAZ segmentation, (c) ground truth (GT) image of FAZ area of (b), and (d)–(f) and (g) are the segmented FAZ area by DL models 1. Unet, 2. Unet_AB, 6. Unet_AB_128_upsampling_Add and 7. LWBNA_Unet, respectively.

