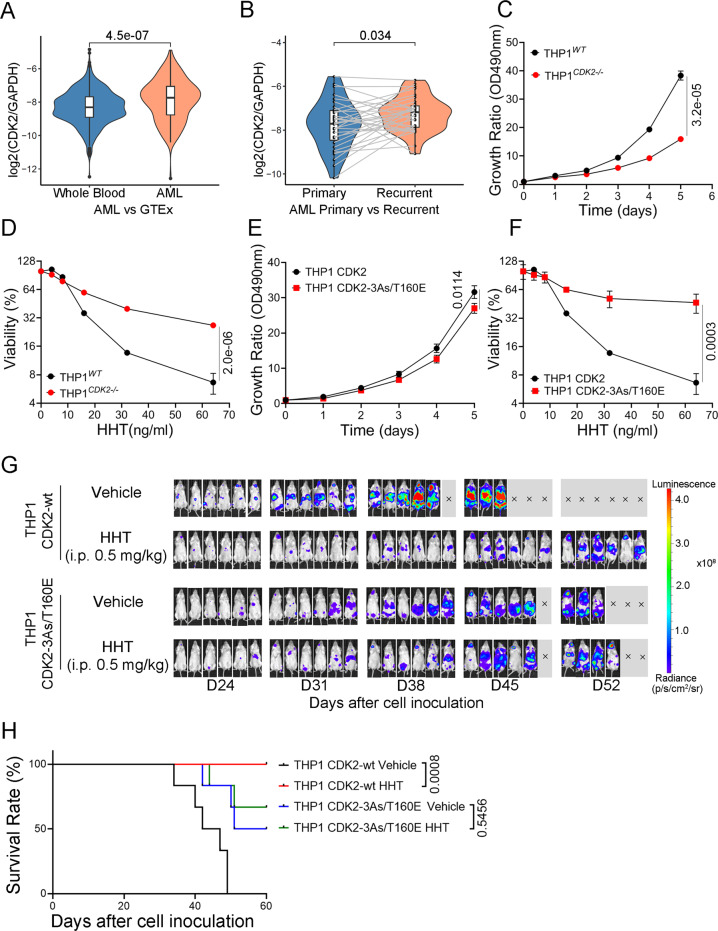
Fig. 2. CDK2 is critical for AML proliferation.
A Normalized expression level (TPM) of CDK2 relative to GAPDH in TARGET-AML (n = 156) and GTEx cohort (n = 1582). B Normalized expression level (TPM) of CDK2 relative to GAPDH in primary and recurred samples using TARGET-AML (n = 31). Box boundaries in A, B are the 25th and 75th percentiles, the horizontal line across the box is the median, and the whiskers indicate the minimum and maximum values. Wilcoxon Test were used in statistical analysis for A, B. C Growth curves of THP1 wild-type and THP1 CDK2 knockout cells. D Cell survival curve of THP1 wild-type and THP1 CDK2 knockout cells after HHT treatment for 24 hours. E Growth curves of THP1 CDK2 and THP1 CDK2-3As/T160E cells. F Cell survival curve of THP1 CDK2 and THP1 CDK2-3As/T106E cells after HHT treatment for 24 hours. Data presented as mean ± SD from four independent biological samples for each group for C–F. P values are indicated by two-tailed unpaired Student’s t test for C–F. G Bioluminescence imaging of luciferase-expressing THP1 (CDK2-wt or CDK2-3As/T160E) xenograft mice models, treated with 0.5 mg/kg HHT (Six mice for each group). H Kaplan–Meier survival of luciferase-expressing THP1(CDK2-wt or CDK2-3As/T160E) xenograft mice models, treated with 0.5 mg/kg HHT or vehicle as the control. P values are calculated by the log-rank test. Source data are provided as a Source data file.

