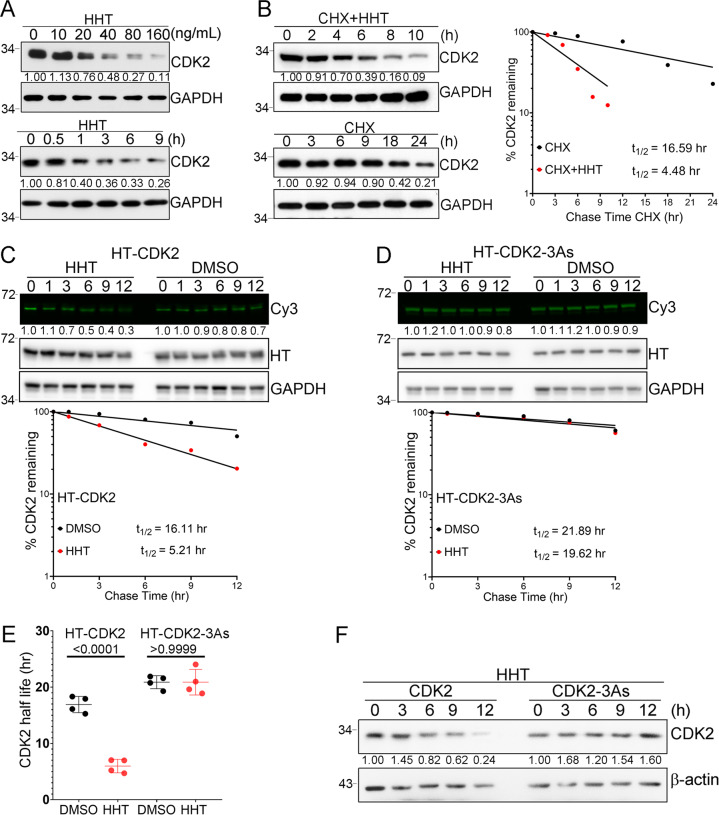
Fig. 3. CDK2 protein degradation in cancer cells induced by HHT treatment.
A Representative western blots for CDK2 and GAPDH protein levels with HHT treatment. B THP1 cells were treated with either CHX (50 μM) alone or CHX plus HHT (40 ng/mL) for the indicated times. The CDK2 and GAPDH protein levels were analyzed by western blot (left panel). CDK2 levels were quantified relative to GAPDH levels and graphed as the percent CDK2 protein remaining after treatment (right panel). Half-lives of CDK2 and CDK2-3As were calculated from exponential line equations and shown as indicated. C Pulse-chase analysis of exogenous CDK2 protein using HT-TMR system in 293T cells transfected with HT-CDK2. After labeled with HT-TMR ligand, the cells were treated with 50 ng/ml of HHT for indicated time and subjected to the following experiment. The HT-TMR ligand-labeled HT-CDK2 was visualized with a fluoro-image analyzer (upper panel) and the total expression of HT-CDK2 was analyzed by western blot with GAPDH as the loading control. The relative amount of HT-TMR ligand-labeled HT-CDK2 was measured with densitometric intensity of each band (lower panel). D Pulse-chase analysis of exogenous CDK2-3As protein using HT-TMR system in 293T cells transfected with HT-CDK2-3As. After labeled with HT-TMR ligand, the cells were treated with 50 ng/ml of HHT for indicated time and subjected to the following experiment. The HT-TMR ligand-labeled HT-CDK2-3As was visualized with a fluoro-image analyzer (upper panel) and the total expression of HT-CDK2-3As was analyzed by western blot with GAPDH as the loading control. The relative amount of HT-TMR ligand-labeled HT-CDK2-3As was measured with densitometric intensity of each band (lower panel). E Summary of exogenous CDK2 and CDK2-3As half-lives in THP-1 cells with or without HHT treatment. Data represent the mean ± SD from four independent biological samples for each group. P values are indicated by two-tailed unpaired Student’s t test. F Representative western blot of CDK2 and CDK2-3As protein levels in THP1 cells treated with HHT (40 ng/mL) for the indicated time. All the results shown here were representative of three independent experiments. Source data are provided as a Source data file.

