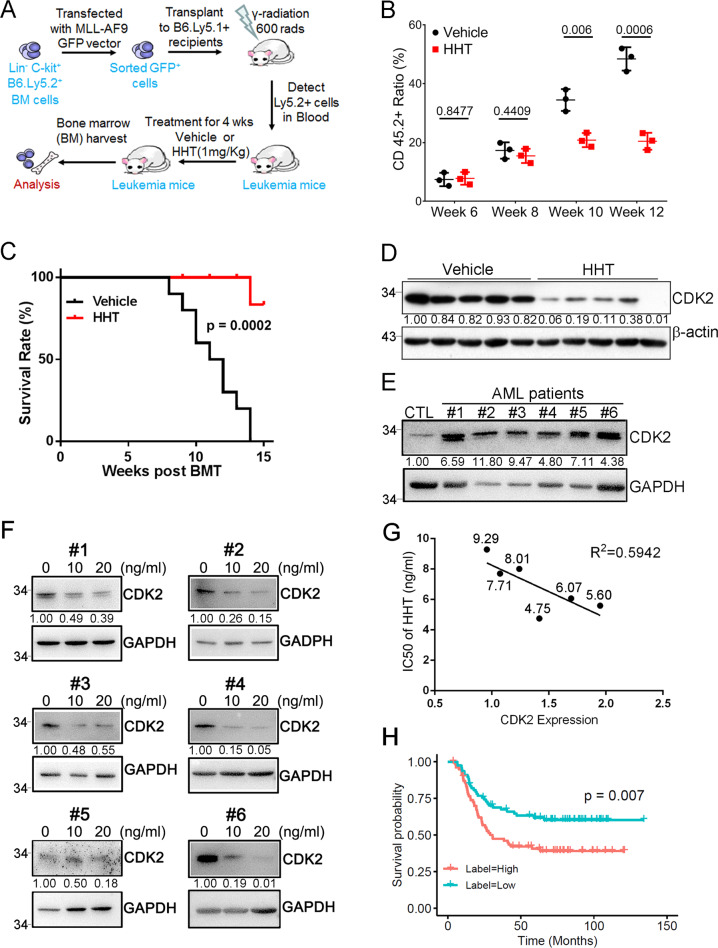
Fig. 4. Induction of CDK2 degradation in vivo.
A Scheme of the MLL-AF9-induced leukemogenesis using a bone marrow transplantation (BMT) assay and pharmacological inhibition by HHT. In these experiments, C57BL/6 (CD45.1) mice were transplanted with hematopoietic progenitors (CD45.2) infected with retroviruses driving the expression of an oncogenic MLL-AF9. When the recipient mice developed leukemia, they received either HHT or vehicle. B Flow-cytometry analysis of leukemic cells (CD45.2+) in peripheral blood of leukemic mice treated as indicated at indicated time points after BMT. Data represent the mean ± SD from three independent biological samples for each group. P values are indicated by two-tailed unpaired Student’s t test. C Kaplan–Meier survival curves of mice with MLL-AF9-induced leukemogenesis treated as indicated (n = 10 mice per group). The p value was calculated by log-rank test. D Representative western blots of both CDK2 (upper panel) and GAPDH (lower panel) levels in bone marrow cells of the indicated mice treated with either HHT or vehicle for 10 weeks. GAPDH was used as a loading control. E Representative western blots of CDK2 expression in BMCs of indicated human primary AML specimens and a healthy donor sample. GAPDH was used as a loading control. Mononuclear cells isolated from primary AML patients and a healthy donor was used for the assay. F Western blot analysis of CDK2 expression in BMCs of indicated human primary AML specimens (E) treated with or without HHT as indicated. G The correlation between CDK2 expression and IC50 of HHT in human primary AML specimens (E). Correlation is shown using r2 and significance was determined using a Spearman correlation. The numbers close to the dots are the IC50 of HHT for each sample (ng/mL). H The overall survival of CDK2 for human AML patients with high (red, n = 78) versus low (blue, n = 78). The patients were dichotomized based on the median value of CDK2 mRNA expression. Wilcoxon Test was used to estimate difference in expression level, and Log Rank test was used in survival analysis. All the results shown here were representative of three independent experiments. Source data are provided as a Source data file.

