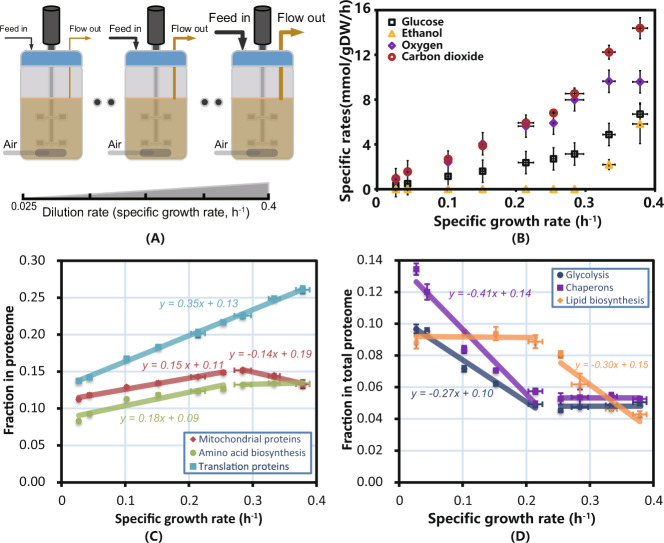
Fig. 1. Experimental design, chemostat series experimental results and linear relationship between different protein categories and specific growth rates.
A The experimental design was based on glucose-limited chemostat cultures operated within a range of dilution rates (equal to specific growth rates, nine different values) from 0.025 to ~0.4 h−1. The line width of the arrow represents the flow of feed and effluent. B Key exchange fluxes measured at different dilution rates. All error bars were obtained based on biological triplicates and data are presented as mean ± SD. C Changes in the fraction of the proteome allocated to translation (ribosome protein), mitochondrial, and amino acid biosynthesis across different specific growth rates. Protein allocation in these regions is correlated with specific growth rates. Error bars derived from n = 3 biologically independent samples and data are presented as mean ± SD. D Changes in the fraction of the proteome allocated to chaperones, glycolysis, and lipid biosynthesis across different specific growth rates. Error bars derived from n = 3 biologically independent samples and data are presented as mean ± SD. Protein allocation in these categories is inversely correlated with the specific growth rate. Source data are provided as a Source Data file.

