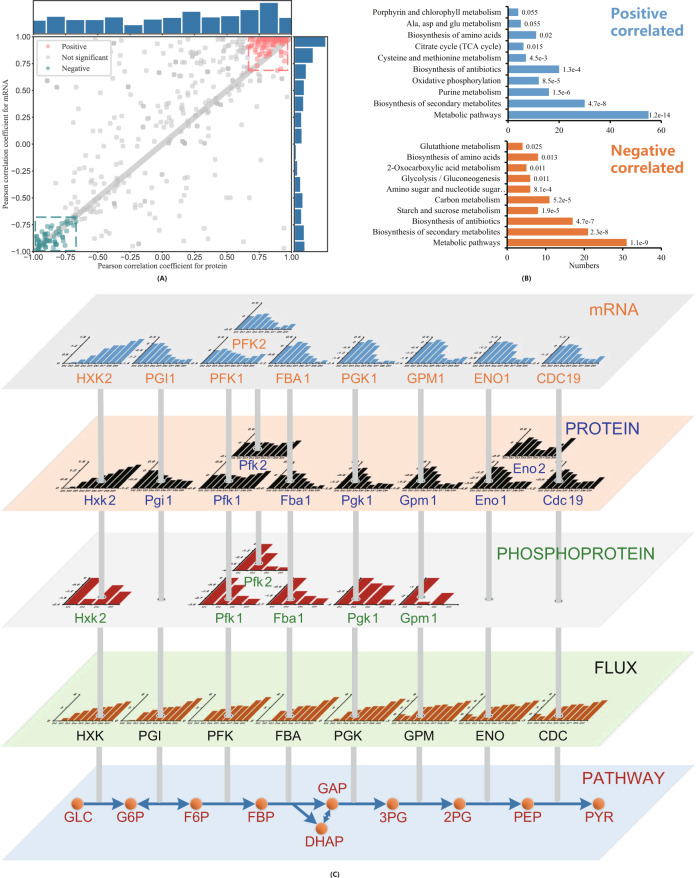
Fig. 3. Correlation analysis between reaction fluxes and abundances of the corresponding mRNA and protein.
A Pearson correlation coefficients for both mRNA/flux and protein/flux pairs, with the distribution of Pearson correlation coefficients for protein/flux pairs shown on the right margin and for mRNA/flux pairs shown on the top margin. B Pathway enrichment analysis for both significantly positively correlated and negatively correlated reactions. Figures above each bar are adjusted p values. C Overview of EMP pathway reactions with changes in absolute reaction fluxes, protein phosphorylation levels, absolute protein abundance and absolute mRNA abundance. The abscissas for all bar plots are specific growth rates of yeast cells. Details of the bar plots included in this panel can be found in the Supplementary Information. Source data are provided as a Source Data file.

