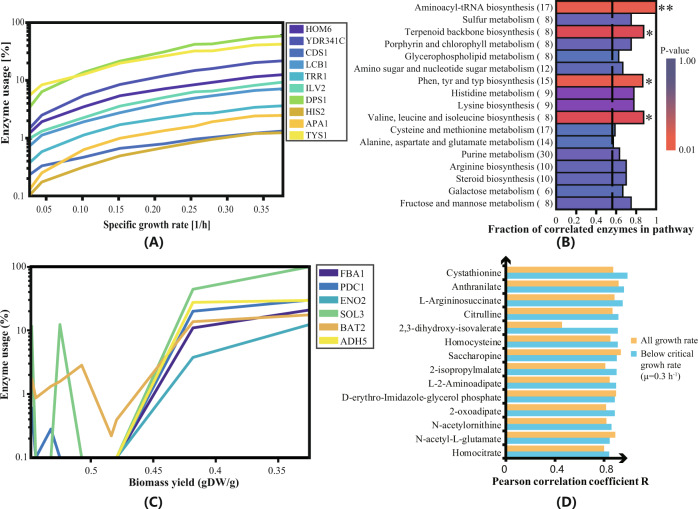
Fig. 4. Enzyme saturation and correlation analysis for various metabolic pathways of S. cerevisiae with a range of specific growth rates covering both respiratory and respirofermentative metabolism.
A Enzyme usage of ten metabolic proteins as a function of specific growth rate (from ∼0.025 to ∼0.4 h−1). B Metabolic pathway enrichment of enzymes correlated with the increasing specific growth rate. Values in parentheses are the number of enzymes in each KEGG pathway, and the p values were calculated by one-sided Fisher’s test (asterisk * indicates a p value <0.1, ** indicates a p value <0.01). C Enzyme usage change trends with different biomass yields for glycolysis enzymes. D Correlation of the abundance of intermediates in the amino acid biosynthesis pathway and specific growth rate under respiratory (blue) and both respiratory and respirofermentative conditions (orange). Source data are provided as a Source Data file.

