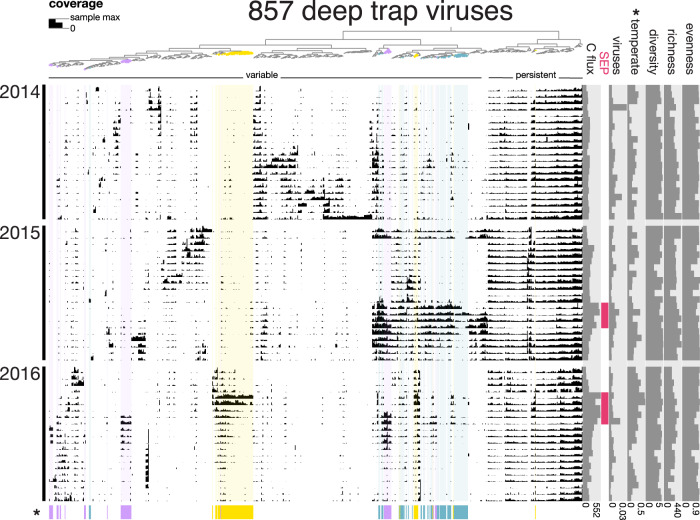
Fig. 1. Coverage abundance profiles of 857 DTV populations across 63 samples.
Each node on the top dendrogram and its associated column represents the coverages of one viral population. The top dendrogram clusters populations based on similarity in coverage abundance profiles. The top row indicates groups that appear to be variable or persistent across samples. Each row represents an individual sample, ordered by time. The height of black bars represents log IQR coverage for each population, normalized to the maximum in that sample. The right panels display sample biogeochemical data: particulate carbon export flux (µmol/m2/day), summer export pulse samples, proportion of total reads mapping to DTVs, abundance-normalized proportion of temperate DTVs, and Shannon’s diversity, richness, and evenness. Three WGCNA clusters of viruses positively correlated with carbon export flux are highlighted in color on the top dendrogram, on the background, and on bottom bars. Asterisks indicate variables that significantly correlate with carbon flux: proportion of temperate phages and WGCNA clusters.

