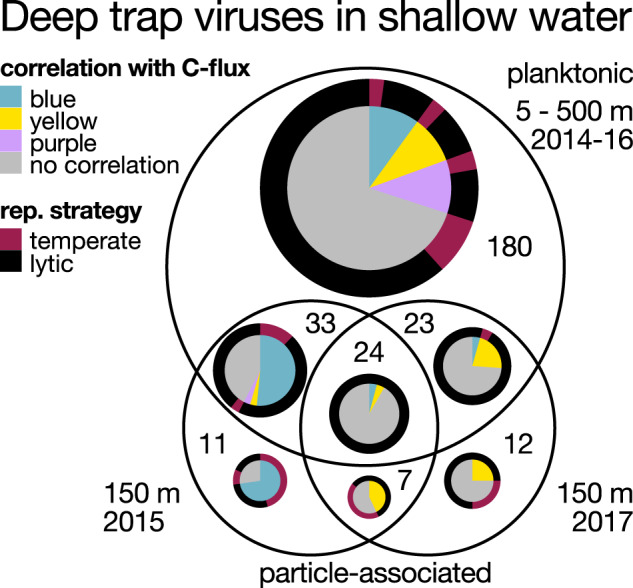
Fig. 4. Characteristics of 290 DTVs observed in shallower water.

Totals represent the number of DTVs that recruited reads (non-zero interquartile coverage) from either one, or combinations of, three shallow-water planktonic (free-living) or sinking particle-associated samples. The inner pie chart indicates membership in one of three groups (blue, yellow, purple) that correlated with particulate carbon export flux, as identified by WGNCA (Table S2). The outer ring indicates viral reproductive strategy, as identified by the presence of prophage markers (PFAM bit score > = 30, Table S2). The pie chart area scales linearly to the number of DTVs in each category.
