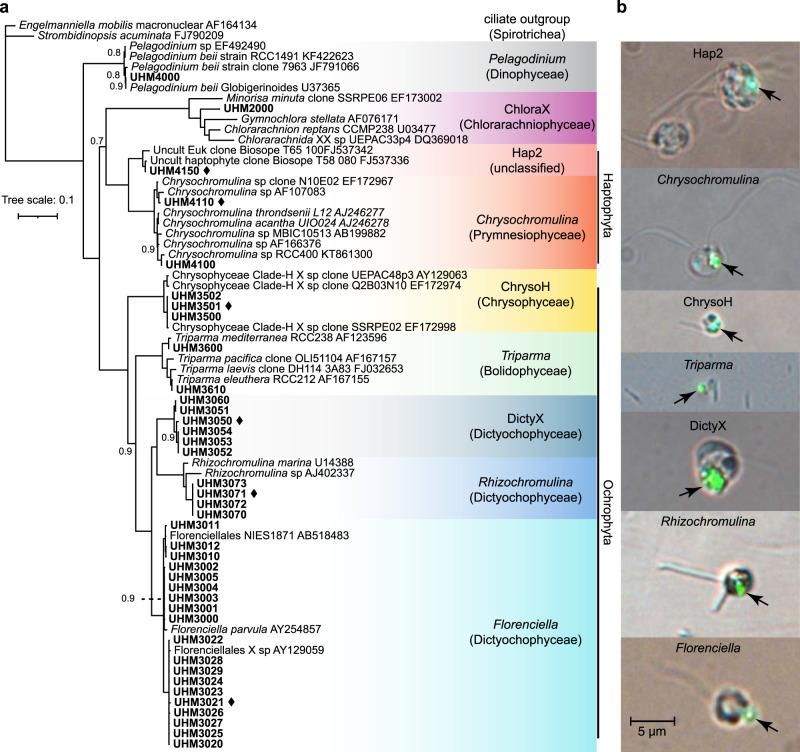
Fig. 1. Phylogenetic diversity among the isolates and visual evidence of phagotrophy.
a A Bayesian majority consensus tree based on near-full length 18S rRNA gene sequences, showing the phylogenetic positions of 39 mixotrophic grazers isolated from the NPSG (in bold). Genera are shaded with different colors and labeled with genus/clade and class (in parentheses). Phylum/division labels are shown vertically in cases where more than one class is represented. The six grazers for which grazing functional responses were determined are marked with black diamonds. Most branches have complete support (posterior probability = 1.0) and only those with lower support (<1.0) are labeled with support values. The scale bar indicates 10% divergence. b Digital micrographs of grazers consuming 0.5-µm fluorescent beads were captured using transmitted light and epifluorescence microscopy. The scale bar is 5 µm.

