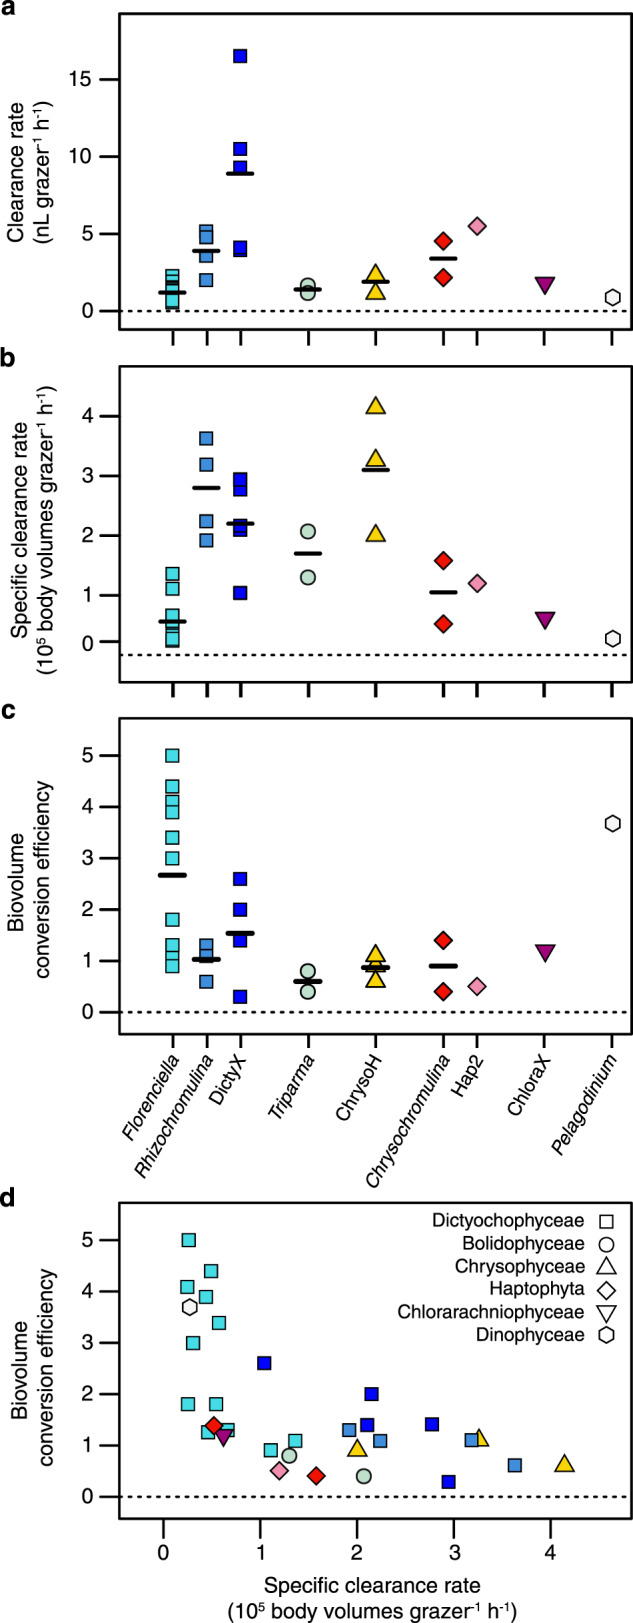
Fig. 3. Comparison of grazing rates and growth efficiencies among NPSG mixotrophs.

Panels show a Clearance rates or b specific clearance rates among isolates in different genera and biovolume conversion efficiencies for isolates c grouped by genus or d plotted as a function of specific clearance rates. Symbols in all panels are colored by genus according to labels in panels c, and genera within a class share a symbol shape (legend in panel d). For genera with multiple isolates, an arithmetic mean is shown by a horizontal bar. Note that for some isolates (marked in bold in Supplementary Table S1) replicated grazing experiments were conducted and the means are presented in this figure.
