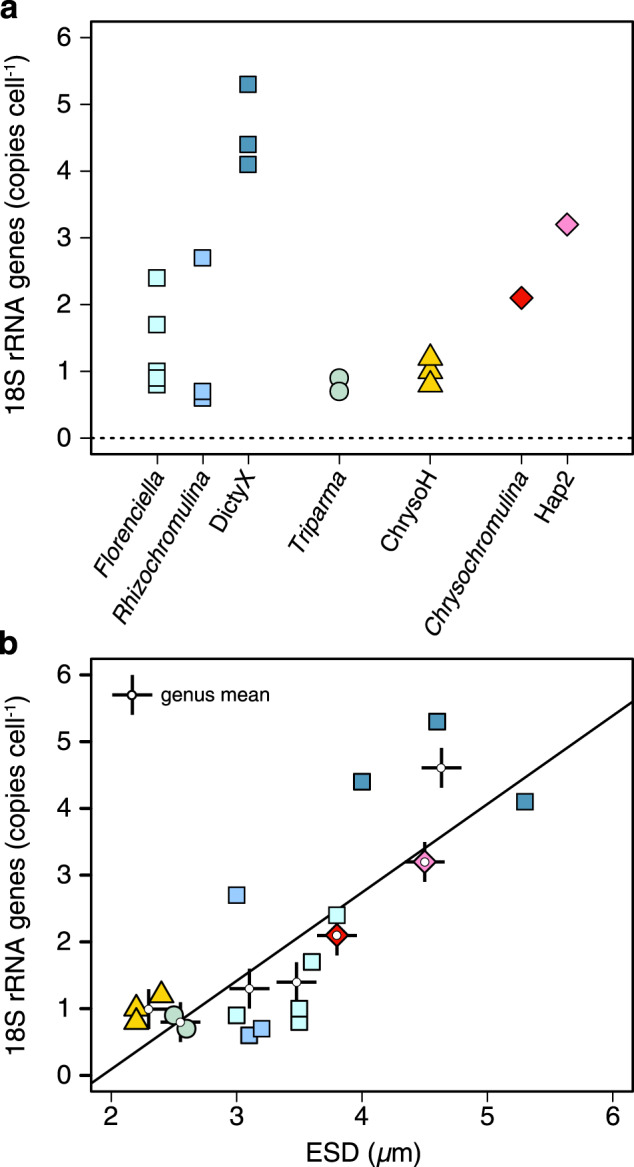
Fig. 6. 18S rRNA gene copy numbers per cell.

Data are shown for a each of seven genera or b plotted as a function of equivalent spherical diameter (ESD) of the cells. Values represent the means for individual isolates (averaged over replicate measurements). In b, symbol colors follow the labels in a. Additional symbols in b (crosses with open circle at center) are mean values for all isolates within a genus. A least-squares linear regression line is plotted for isolate means (R2 = 0.61).
