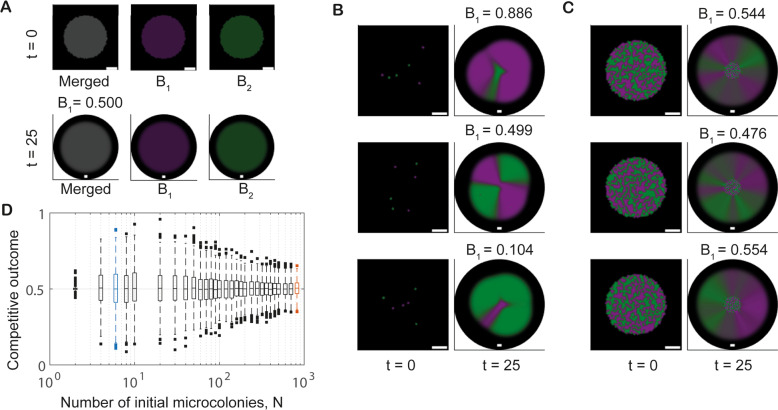
Fig. 2. Spatial structure and variability in competitive outcome depend on founder density.
A–C Example model realisations for different founder densities. All plots show the system’s initial conditions () and the outcomes after 25 time units. Plots visualising the systems’ states at show a blow-up of the subdomain ; plots visualising outcomes at show the full computational domain (black background). The scalebars are seven unit lengths long. A The outcome of simulations initialised with piecewise spatially homogeneous populations representing high founder density. The ‘Merged’ image channel shows both strains (grey colour corresponds to overlap); the (green) and (magenta) channels only show single strain filters of the plot. B The range of outcomes observed for low founder density (number of initial cell patches ). C The range of outcomes for intermediate founder densities (). In (B, C) only the ‘Merged’ channel is shown. D Variability in competitive outcome increases with decreasing founder density. Each boxplot contains data from 1000 model realisations. Blue and red boxplots correspond to the founder densities in B and C, respectively.

