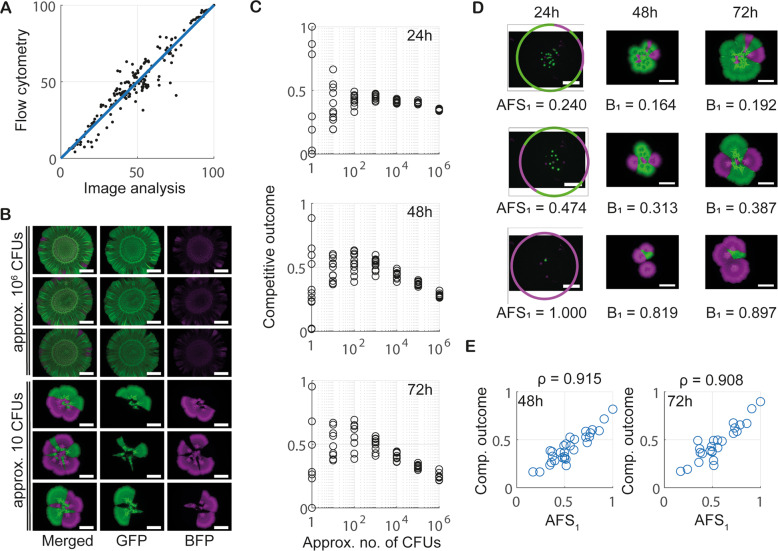
Fig. 4. Experimental data confirm modelling hypotheses.
A Comparison of image analysis with flow cytometry. A scatter plot comparing measurements of relative density of the mTagBFP-labelled strain obtained from image analysis and flow cytometry is shown. Each data point corresponds to one biofilm, which was imaged before being analysed by flow cytometry. The data contains measurements taken from all strain pairs, all founder densities, and all time points. The solid blue line shows the identity , with the coefficient of determination being . B Example images of single-strain biofilms consisting of GFP (green) and mTagBFP (magenta, ) labelled copies of 3610. Taken after 72 h of incubation and shown for two different founder densities (scalebar 5 mm). C Strain density data. Competitive outcome measurements taken after 24 h, 48 h and 72 h of biofilm incubation. Plotted are technical repeats from one biological repeat of the experiment. The full data set is presented in Fig. S5A. D Example visualisations of AFS score calculations. Three example biofilms images at 24 h (left), 48 h (middle) and 72 h (right). The strains are as described in B. Images at 24 h show the reference circle used for the AFS1 score. E The relationship between AFS1 and competitive outcome for . AFS was calculated from images taken at 24 h, and competitive outcome for after 48 h (left, ) and 72 h (right, ). The linear correlation coefficient is indicated.

