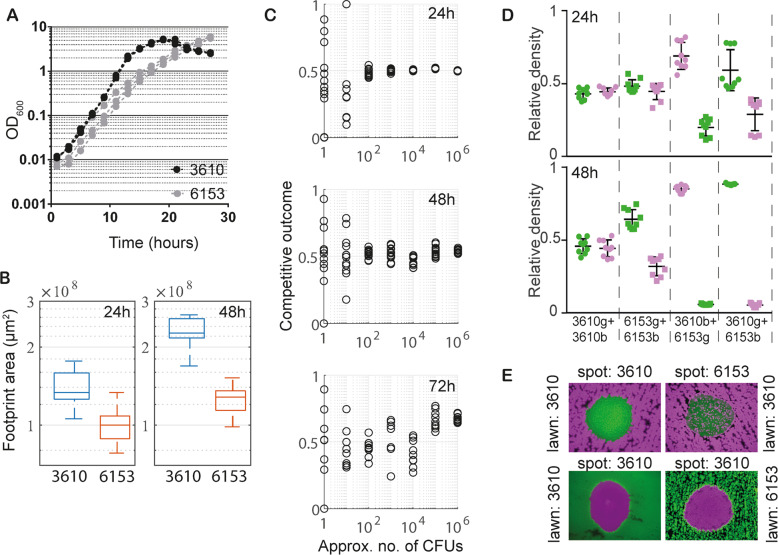
Fig. 6. Selection of a competitive strain.
A Growth curves of 3610 (black) and 6153 (grey) in MSgg cultures at 30 °C. The three lines shown for each isolate represent separate biological repeats. B Biofilm footprint area of single-strain 3610 and 6153 biofilms. Data from 18 and 16 biofilms are shown for the 24 h and 48 h timepoint, respectively. C Competitive outcome data from colony biofilm assays of isogenic 6153 biofilms are shown after 24 h, 48 h and 72 h of incubation. Plotted are the technical repeats from one biological repeat. The full data set is presented in Supplementary Fig. S8A. D Flow cytometry data of mixed biofilms grown for 24, 48, and 72 h at 30 °C on MSgg media. Isolate names followed by ‘g’ represent strains constitutively producing GFP, (green on the graph). Isolate names followed by ‘b’ indicate strains constitutively producing mTagBFP, (magenta on the graph). Three biological and three technical replicates were performed for each strain mix and timepoint and all data points are shown. The error bars represent the mean standard deviation. E Halo formation assays on MSgg agar plates at 24 h of growth. Strains producing mTagBFP (magenta) and GFP (green) are shown.

