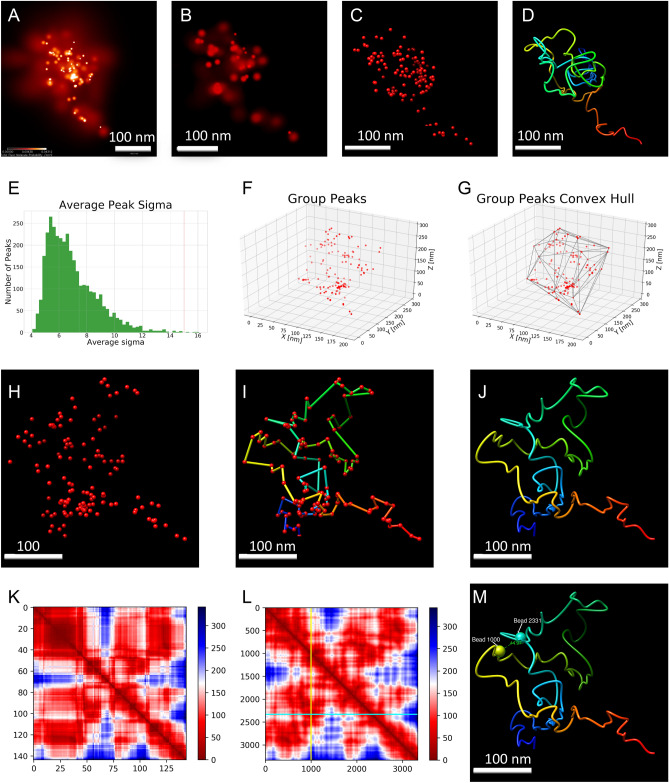
Figure 2.
Processing and modeling pipeline for iPALM images based on image #17. (A) 2D image of the target chromatin region generated by PeakSelector. Color bar represents the probability of molecule presence per nm2 with white and dark red colors representing the high and low probability respectively. (B) 3D image of the target chromatin region (C) Group peaks visualized as points in 3D space. (D) 3D polymer model reconstructed from group peaks. The blue color represents the beginning of the model structure, red color represents the end. (E) Average sigma for each peak in the image. (F) 3D position plot of group peaks. (G) The convex hull of group peaks. (H–J) Modeling pipeline used to reconstruct chromatin loop in image # 17 (H) Group peaks in 3D space (I) Model generated by connecting group peaks using travelling salesman problem-solving algorithm (TSP). (J) Model smoothed using spline interpolation. (K) Distance heatmap from TSP model showing physical distances (in nm) between pairs of beads in the model. (L) Distance heatmap from interpolated TSP model showing physical distances (in nm) between pairs of beads in the model. Dashed lines represent loop anchors, (also shown in Fig. 2 M as yellow and teal spheres). (M) 3D model of chromatin loop captured in image #17. Beads 1000 (cyan) and bead 2331 (yellow) mark loop anchors. Distance (44.97 nm) between anchors is also shown.

