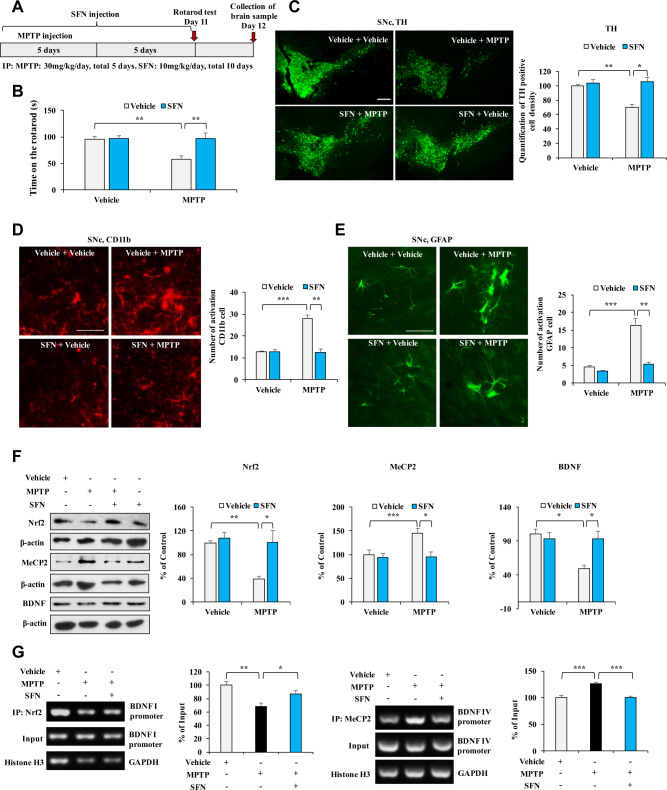
Fig. 3. Effects of SFN on rotarod behavior and dopaminergic neurotoxicity in the SNc of MPTP-treated mice.
A The schedule of treatments of MPTP and SFN. B The rotarod test showed that SFN attenuated MPTP-induced decreased of the rotarod time. Data are shown as mean ± SEM (n = 8 or 10). *P < 0.05, **P < 0.01 (two-way ANOVA: MPTP: F1,31 = 5.392, P = 0.028; SFN: F1,31 = 5.732, P = 0.024; interaction: F1,31 = 5.150, P = 0.031). C The immunofluorescence staining for TH in the SNc of mice treated with SFN or/and MPTP and quantification analysis of the TH staining in the SNc. Scale bar = 50 μm. Data are shown as mean ± SEM (n = 4). *P < 0.05, **P < 0.01 (two-way ANOVA: MPTP: F1,15 = 5.125, P = 0.043; SFN: F1,15 = 9.606, P = 0.009; interaction: F1,15 = 6.235, P = 0.028). D The immunofluorescence staining for CD11b in the SNc of mice treated with SFN or/and MPTP and quantification analysis of the CD11b staining in the SNc. Data are shown as mean ± SEM (n = 4). *P < 0.05, **P < 0.01 (two-way ANOVA: MPTP: F1,15 = 14.652, P = 0.002; SFN: F1,15 = 16.345, P = 0.002; interaction: F1,15 = 16.549, P = 0.002). Scale bar = 50 μm. E The immunofluorescence staining for GFAP in the SNc of mice treated with SFN or/and MPTP and quantification analysis of the GFAP staining in the SNc. Scale bar = 50 μm. Data are shown as mean ± SEM (n = 4). *P < 0.05, **P < 0.01 (two-way ANOVA: MPTP: F1,15 = 21.504, P = 0.001; SFN: F1,15 = 16.644, P = 0.002; interaction: F1,15 = 10.459, P = 0.007). F The effects of SFN on the expression of Nrf2, MeCP2, and BDNF in the SNc of mice treated with SFN or/and MPTP. Data are shown as mean ± SEM (n = 6). **P < 0.01 (two-way ANOVA: Nrf2, MPTP: F1,23 = 8.578, P = 0.008; SFN: F1,23 = 8.951, P = 0.007; interaction: F1,23 = 5.320, P = 0.032; MeCP2, MPTP: F1,23 = 5.342, P = 0.032; SFN: F1,23 = 8.166, P = 0.010; interaction: F1,23 = 4.903, P = 0.039; BDNF, MPTP: F1,23 = 8.610, P = 0.008; SFN: F1,23 = 4.591, P = 0.045; interaction: F1,23 = 8.548, P = 0.008). G The ChIP-PCR analysis in SFN or/and MPTP-treated mice. The binding affinity of SFN for Nrf2 and Bdnf I promoter and MeCP2 for Bdnf IV promoter in SNc of MPTP-treated mice. Data are shown as mean ± SEM (n = 4). *P < 0.05, **P < 0.01, ***P < 0.001 (one-way ANOVA: Nrf2: F2,14 = 7.706, P = 0.007, MeCP2: F2,14 = 18.17, P < 0.01).

