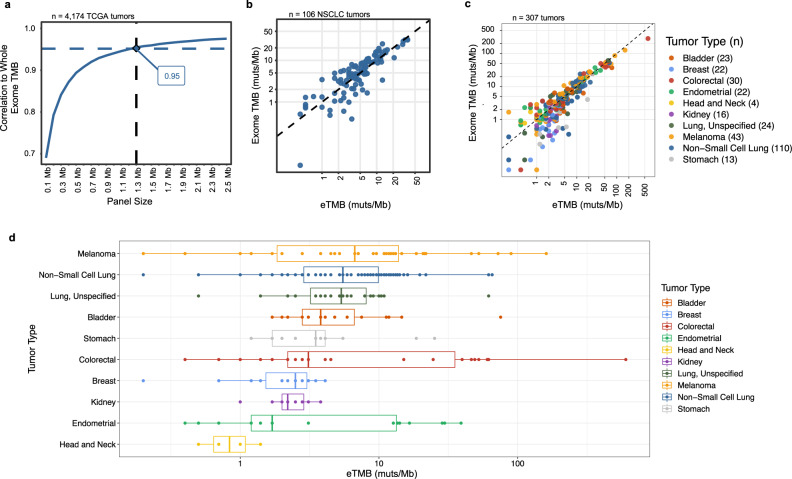
Fig. 3. In silico and experimental comparison of the targeted panel and whole-exome TMB performance.
a The correlation of in silico predicted tumor mutation burden (TMB) for panels of different size (100 kilobases to 2.5 megabases, Mb) to observed whole-exome sequencing (WES) TMB for samples in The Cancer Genome Atlas (TCGA) suggested that panels of >1 Mb provide accurate TMB measurements. TMB analyses were performed in a metastatic population weighted according to the relative frequency of late-stage cases per year. b Comparison of the elio-predicted exome TMB (eTMB) using elio tissue complete and WES of tumor and matched-normal samples in a cohort of 106 non-small cell lung cancer (NSCLC) FFPE and cell-line samples resulted in high concordance in a cross-validated analysis (Pearson correlation = 0.909, P < 0.0001 and Spearman rho = 0.855, P < 0.0001). c Evaluation of eTMB in an independent cohort of 307 FFPE-derived pan tumor samples demonstrated high correlation to WES (Pearson correlation = 0.949, P < 0.0001 and Spearman rho = 0.870, P < 0.0001). d Distribution of eTMB scores in the independent cohort of 307 FFPE-derived tumors by tumor type, with the number of each tumor type captured in (c). The boxes represent the 25th and 75th percentile (interquartile range, IQR), while the median is reflected by the middle line of the box. The whiskers represent 1.5*IQR, with outliers plotted as points not connected to the whiskers. The Pearson and Spearman correlation coefficients were calculated using a two-sided test, and no adjustments were made for multiple comparisons. Source data are provided as a Source Data file. Muts/Mb mutations per megabase.

