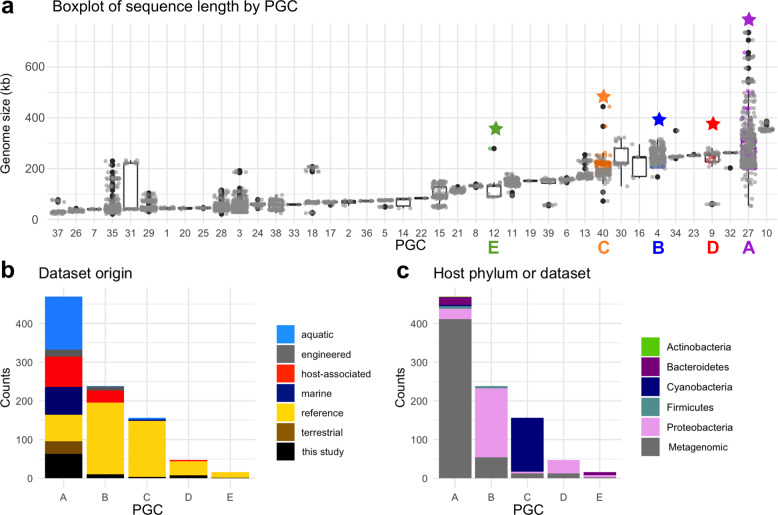
Fig. 2. Statistics of the Phage Genomes Clusters (PGCs).
a Boxplot of genome length in each network cluster (x-axis is PGC number). Star denotes PGC with a marine jumbo phage and the color matches the PGC letters of Fig. 1. b Stacked barplot of the metagenome environment from which each phage derives from in each PGC (x-axis). Reference (yellow) are cultured phages, in black are the bins of jumbo phages from this study. c Stacked barplot of the host phylum of the RefSeq cultured phages in each cluster; metagenomic phages are in gray.

