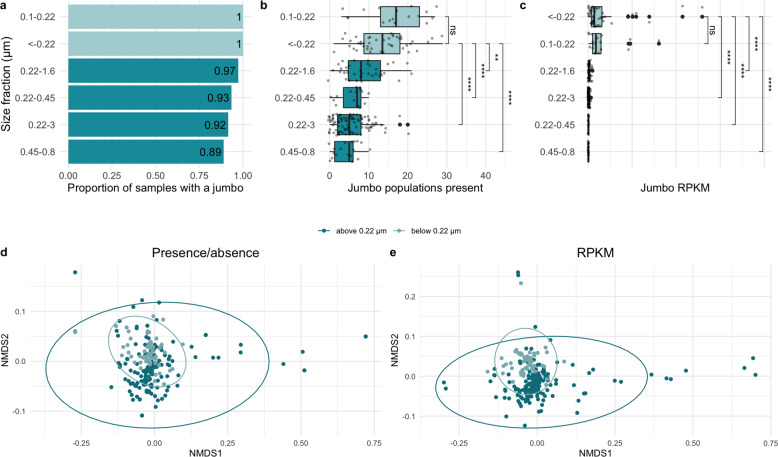
Fig. 4. Comparison of jumbo phage abundance and presence in samples of different filter size fractions.
Dark teal are fractions with minimum sizes of 0.22 μm or higher. Light teal are fractions with a maximum size of 0.22 μm or lower. a Barchart of the proportion of samples with at least one marine jumbo phage (x-axis) by size fraction (y-axis) sorted from highest to lowest. b Boxplot with x-axis as the number of marine jumbo phages found in a sample with size fraction on the y-axis sorted by median. c Boxplot with x-axis as the relative abundance of marine jumbo phages found in a sample (RPKM) with size fraction on the y-axis sorted by median. Significance bars in c, d correspond to Wilcox tests, with stars corresponding to p values < 0.05 (* < 0.05, ** < 0.01, *** < 0.001, **** < 0.0001) and those with p values > 0.05 as not significant "ns" (stat_compare_means function). NMDS plots (Bray Curtis dissimilarity distances) of jumbo phage composition in each sample using presence absence data (d) and relative abundance data (e). Samples are colored by size fraction distinction above 0.22 μm (dark teal) and below 0.22 μm (light teal). Ellipses calculated based on multivariate normal distribution.

