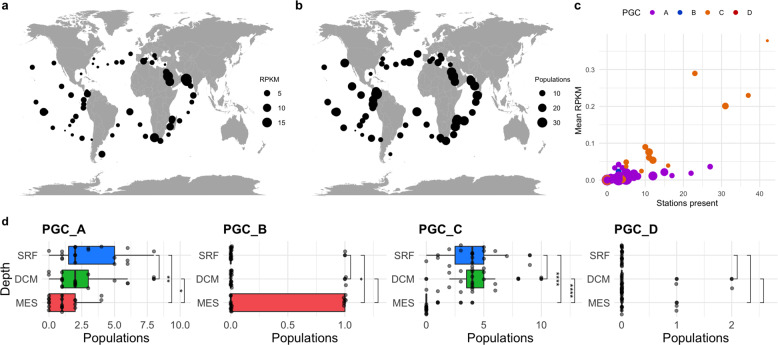
Fig. 5. Biogeography of marine jumbo phages.
Maps of the relative abundance (a) of total jumbo phages (in RPKM) and (b) total number of jumbo populations present regardless of phage cluster membership in each surface (SRF) sample of the picoplankton size fraction (either 0.22–3 μm or 0.22–1.6 μm depending on availability). Dots sizes are proportional to the number of populations or RPKM. c Scatterplot of the mean RPKM of a jumbo population in SRF picoplankton samples versus the number of SRF picoplankton stations it was present. Populations are colored by PGC and size corresponds to putative genome length in 100 kilobases. d Boxplot of the number of jumbo phage populations in samples co-collected at each depth sorted by mean for each PGC. Significance bars correspond to Wilcox tests, with stars corresponding to p values < 0.05 (* < 0.05, ** < 0.01, *** < 0.001, **** < 0.0001) (stat_compare_means function).

