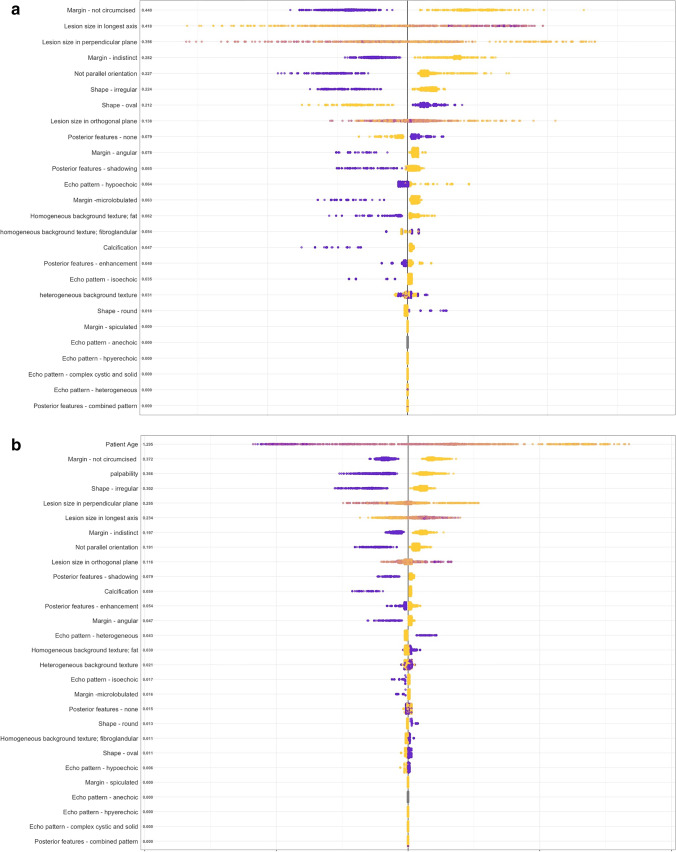
Fig. 4.
Shapley Additive Explanations (SHAP) Value Summary Plot of the Extreme Gradient Boosting (XGBoost) Tree Model. a XGboost – unimodal Algorithm. SHAP values on the left side of the x-axis indicate that the variable was important for predicting malignancy; values on the right side indicate that the variable was important for predicting a benign breast mass. Purple indicates a high variable value (e.g. margin – non-circumscribed: yes); yellow indicates a low variable value (e.g age: lower patient age). The values on the y-axis represent the overall global variable importance. b XGboost – multi-modal Algorithm

