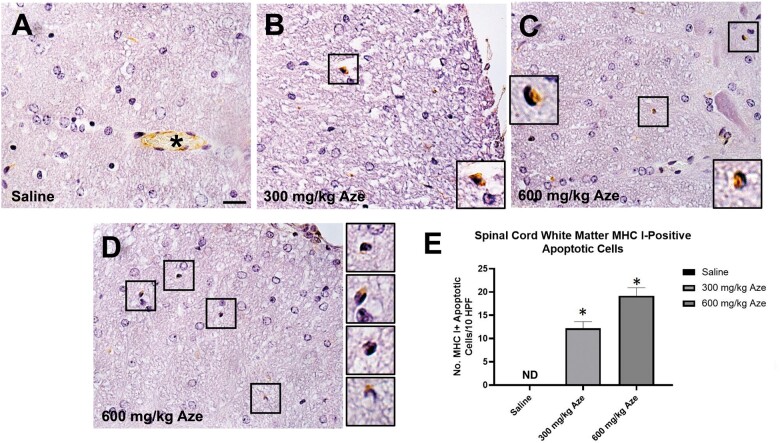
FIGURE 10.
Apoptotic OL in white matter of Aze-treated mice are immunostained for MHC I (Experiment A1). (A) Saline control shows no MHC 1 immunostaining of OL. Asterisk indicates positive control staining of endothelial cells in a microvessel. (B–D) Positive staining of individual cells with pyknotic or apoptotic nuclei from samples at the indicated levels of Aze exposure. Cells in boxes are shown at higher power in insets and adjacent. Original magnification: 240×. (E) Counts of MHC 1-positive cells in Aze-treated mice. 300 mg/kg versus 600 mg/kg, p = 0.0146, t-test. ND, not done.

