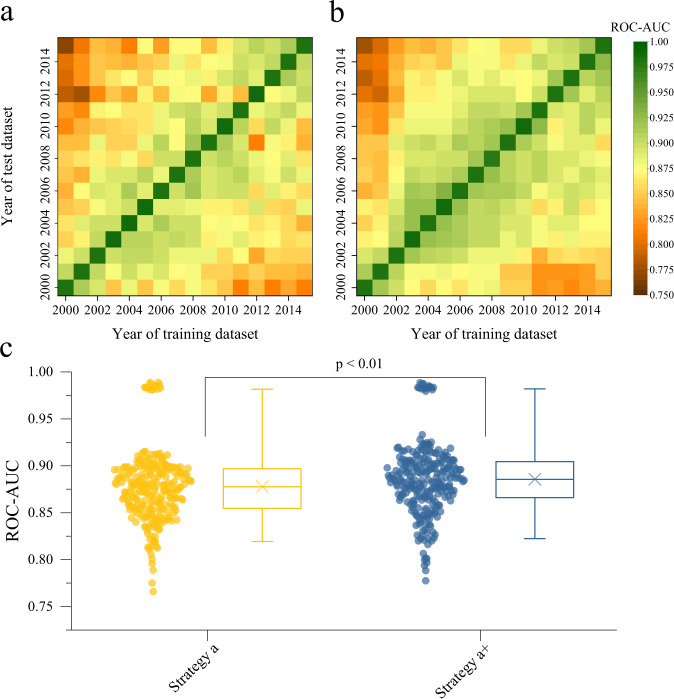
Fig. 1. Validated performance on a time scale of the boosted regression tree models.
The boosted regression tree (BRT) models were trained on one-year incidence samples under strategies a (a) and a+ (b). Throughout the validation process, the values of area under the receiver operator characteristic curve (ROC-AUC) range from 0.750 (Dark brown) to 1 (Green). The p value (p = 0.0013) was determined by the two-tailed Mann–Whitney test (n = 256), representing a comparison (c) between strategies a (the pairing of stable background contexts with one-year climate deviation related covariates) and a+ (same as a, but with two-year climate deviations) during the validation process. For each box plot, the ‘×’ indicates the mean; the box indicates the upper and lower quartiles and the whiskers indicate the 5th and 95th percentiles of the data.

