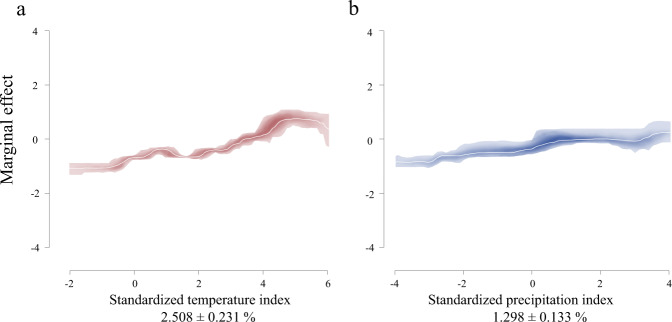
Fig. 2. Marginal effect curves of each climate deviation related covariate.
The marginal effect curves of (a) standardized temperature index and (b) standardized precipitation index were generated by the boosted regression tree (BRT) ensemble fitted to the full incidence samples under strategy a+. The white lines represent the mean effect curves calculated from the ensemble BRT models. 95% confidence intervals of climate variables are indicated by color: red, standardized temperature index; blue, standardized precipitation index. Sub-plots are ordered by the mean relative contribution (%) of covariates, with ± standard deviation (%) given within each sub-plot.

