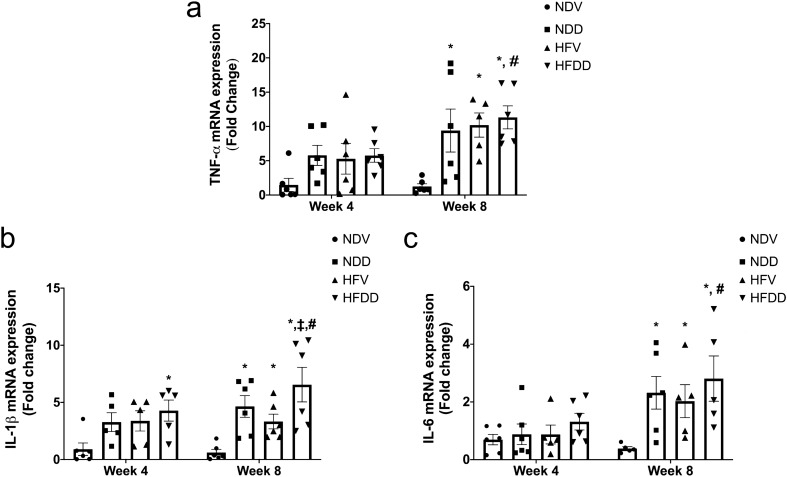
Figure 3.
D-galactose-induced aging aggravated bone inflammation in the obese-insulin resistant condition. (a) TNF-α mRNA expression in bone tissues at the indicated time points, (b) IL-1 β mRNA expression in bone tissues at the indicated time points, (c) IL-6 mRNA expression in bone tissues at the indicated time points. Bar graphs are presented as mean ± SEM (n = 5–6/group). * p < 0.05 versus NDV at the same time point, † p < 0.05 versus NDD at the same time point, ‡ p < 0.05 versus HFV at the same time point, # p < 0.05 versus same group at the different time point. HFDD, high-fat diet with D-galactose; HFV, high-fat diet with vehicle; IL-1 β, interleukin-1β; IL-6, interleukin-6; NDD, normal diet with D-galactose; NDV, normal diet with vehicle: TNF-α, Tumor necrosis factor alpha.

