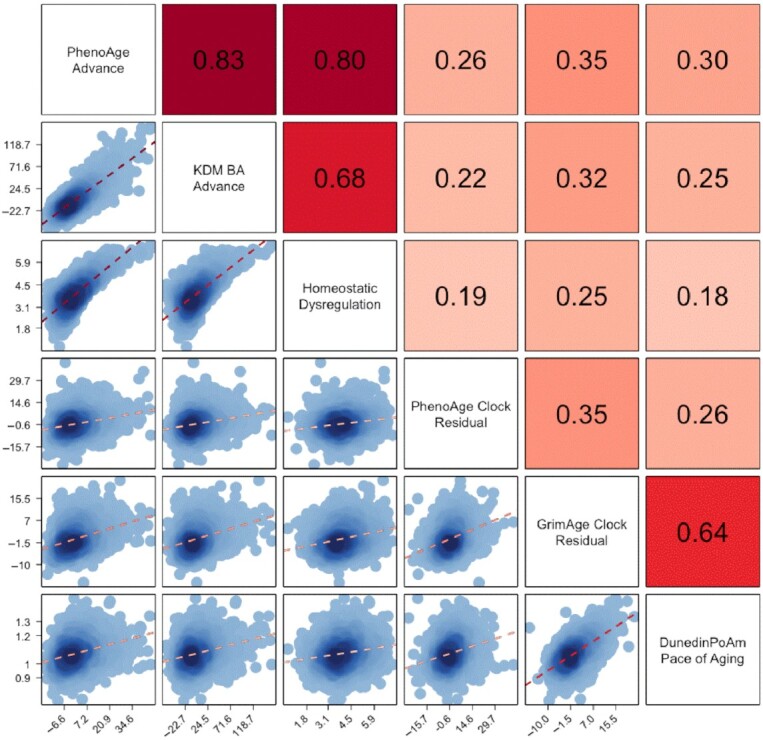
Fig. 1.

Correlations among 3 blood-chemistry and 3 DNAm measures of biological aging among Black and White participants in the US HRS. Biological aging measure labels are listed on the matrix diagonal. Pearson correlations are shown above the diagonal. Correlations are reported for the biological aging measures listed below and to the left of the cell. Scatterplots and linear fits illustrating associations are shown below the diagonal. The Y-axis of the plots correspond to the biological aging measure to the right of the cell. The X-axis of the plots correspond to the biological aging measure above the cell. Sample sizes for correlations among blood-chemistry measures are n = 9,255. Sample sizes for correlations between blood-chemistry and DNAm measures and among DNAm measures are n = 3,976.
