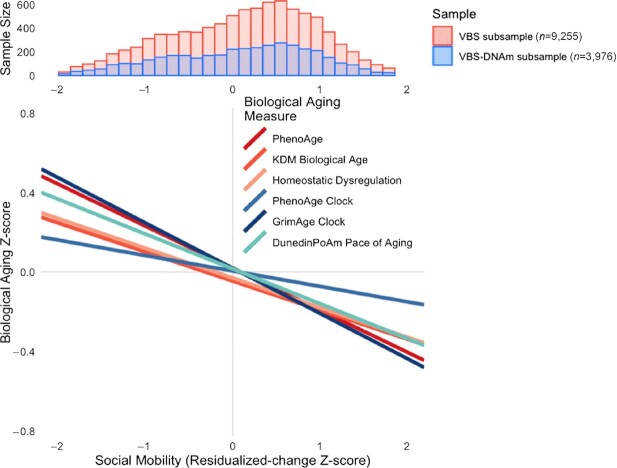
Fig. 3.
Effect-sizes for associations of life course social mobility with 3 blood-chemistry and 3 DNAm measures of biological aging. The histogram at the top of the figure shows the distribution of social mobility in percentile rank terms in the full HRS VBS (n = 9,255; red bars) and the DNAm subsample (n = 3,976; blue bars). The line plot at the bottom of the figure shows the association of social mobility with 6 measures of biological aging. Blood-chemistry-based measures are plotted in red shades. DNAm measures are plotted in blue shades. The figure shows that, across methods, upward social mobility was associated with less-advanced and slower biological aging.

