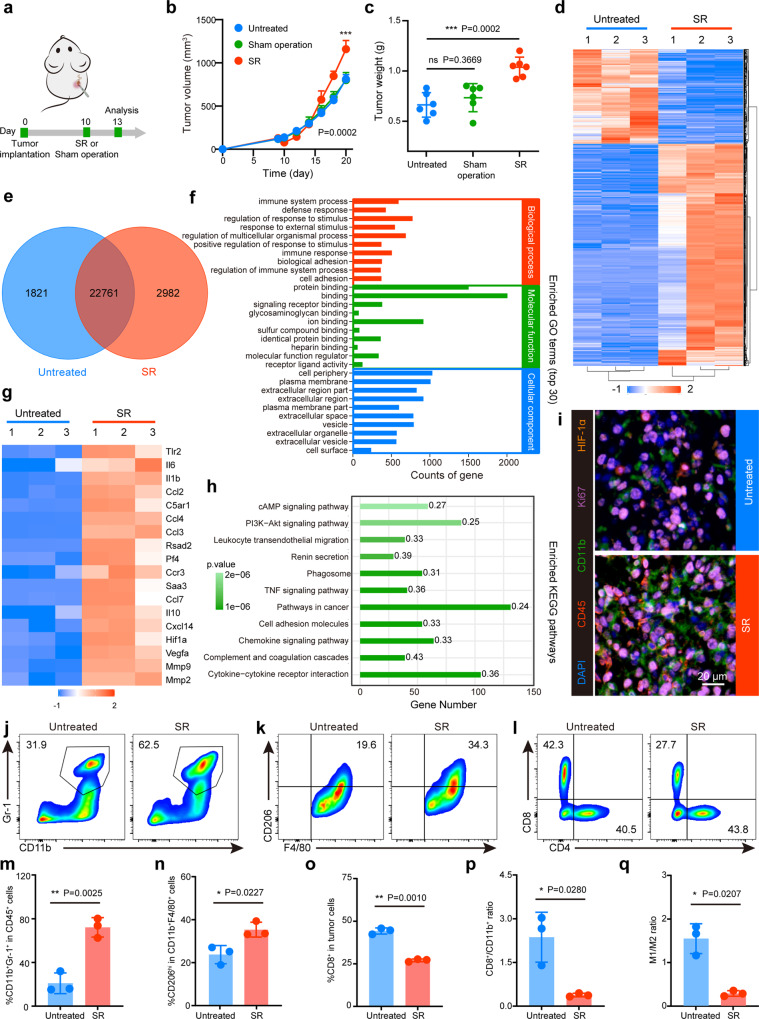
Fig. 2. SR-driven immunosuppression accelerates local tumor progression.
a Schematic illustration of surgical resection (SR) treatment. 1×10⁶ CT26 cells were subcutaneously injected into the right flank of BALB/c mice. SR or sham operation was conducted on the right tumor or left skin, respectively, on day 10 postinoculation. b Residual tumor growth kinetics of mice in Untreated, SR and Sham operation groups (n = 6 mice). c Weight of the excised tumor on day 20 after varied treatments (n = 6 mice). d, e Cluster analysis (d) and Venn diagram (e) of differential expression genes in RNAseq between untreated and SR-treated tumors three days post treatment (n = 3 mice). Red and blue colors represent upregulated or downregulated genes, respectively. f Significant enrichment in gene ontology (GO) terms (top 30, n = 3 mice). g Heatmap of differentially expressed genes associated with tumor progression and immunosuppression (n = 3 mice). Red and blue colors represent upregulated or downregulated genes, respectively. h Kyoto Encyclopedia of Genes and Genomes (KEGG) enrichment histogram of differentially expressed genes (Statistical difference was calculated using Fisher’s exact test, n = 3 mice). i Representative polychromatic immunofluorescent staining images of tumors from three biologically independent samples showing CD45+ (red), CD11b+ (green), Ki67+ (purple) and HIF-1α+ (orange) cells infiltration for Untreated and SR tumors three days post-treatment. j–o Representative flow cytometric images and the corresponding quantification of MDSCs (CD11b+Gr-1+CD45+) (j, m), TAMs-M2 (CD206hiCD11b+F4/80+CD45+) (k, n) and CTLs (CD8+CD3+CD45+) (l, o). p The ratio of CD8+ cells to CD11b+ MDSCs in tumors. q The ratio of M1 to M2 in tumors. SR, surgical resection; MDSCs, myeloid-derived suppressor cells; TAMs-M2, M2-like macrophages; TAMs-M1, M1-like macrophages; CTLs, cytotoxic T lymphocytes. Data were expressed as means ± SD (n = 3 biologically independent samples). Statistical difference was calculated using two-tailed unpaired student’s t-test. ns, not significant, *P < 0.05, **P < 0.01 and ***P < 0.001. The experiments were repeated three times. Source data are provided as a Source Data file.

