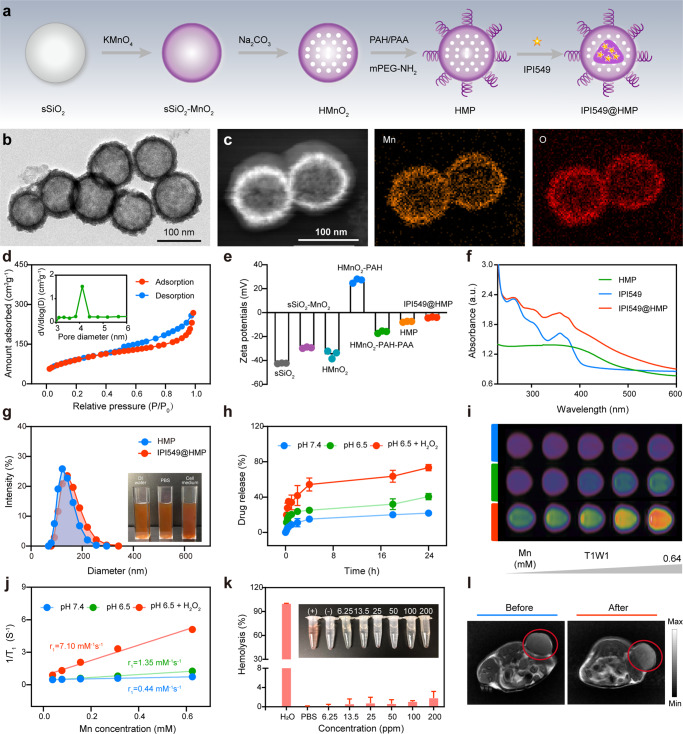
Fig. 3. Schematic and characterization of HMP-based nanoplatform.
a A scheme indicating the step-by-step synthesis of HMP nanoparticles and the subsequent drug loading. b The representative TEM image of HMP nanoparticles from three independent samples. c The representative HAADF-STEM image and corresponding elemental mappings of HMP nanoparticles from three independent samples. d The representative N2 absorption-desorption isotherms and pore size distribution (inset) of HMnO2 nanoparticles from three independent samples. e Zeta potential variations in the preparation procedure of IPI549@HMP nanoparticles. Data were expressed as means ± SD (n = 3 independent samples). f Representative UV-vis spectrums of free IPI549, HMP and IPI549@HMP from three independent samples. g Representative particle-size distributions of HMP and IPI549@HMP from three independent samples (Inset: digital photos of IPI549@HMP dispersed in deionized water, PBS and cell culture medium). h Cumulative release kinetics of IPI549 from HMP in varied conditions. i Representative T1-weighted MR images of different concentrations of IPI549@HMP dispersed in varied conditions from three independent samples. j Representative relaxation rate r1 versus Mn2+ concentrations when dispersed in varied conditions from three independent samples. k Concentration-dependent hemolysis and relative digital photo (inset) of IPI549@HMP. Data were expressed as means ± SD (n = 3 independent samples). H2O and PBS were set as positive and negative control, respectively. l Representative T1-weighted MR images of CT26 tumor-bearing mice before and after IPI549@HMP intravenous injection from three biologically independent samples. The red circle indicates tumor tissue. Source data are provided as a Source Data file.

