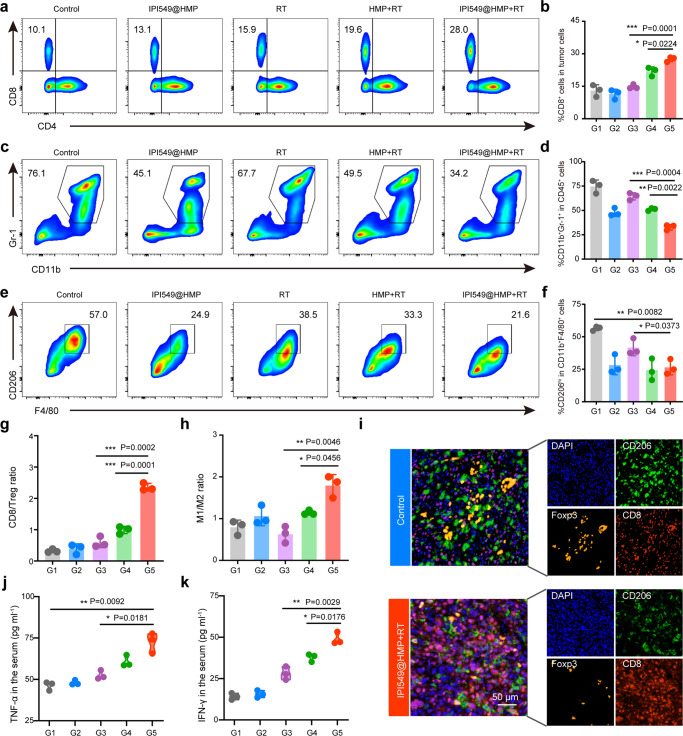
Fig. 6. Robust antitumor immune responses triggered by IPI549@HMP-augmented RT.
a–f Representative flow cytometric analysis and relative quantification of CTLs (CD8+CD3+CD45+) (a, b), MDSCs (CD11b+Gr-1+CD45+) (c, d) and TAM-M2 (CD206hiCD11b+F4/80+CD45+) (e, f). g, h Quantification by flow cytometry of CD8/Treg (g) and M1/M2 ratios (h). i Representative polychromatic immunofluorescent staining images of tumors from three biologically independent samples showing DAPI (blue), CD206+ (green), Foxp3+ (orange) and CD8+ (red) cells infiltration for Control and IPI549@HMP + RT groups. j, k Cytokine levels of TNF-α (j) and IFN-γ (k) in the serum after varied treatments. G1, Control; G2, IPI549@HMP; G3, RT; G4, HMP + RT; G5, IPI549@HMP + RT. RT, radiotherapy; CTLs, cytotoxic T lymphocytes; Tregs, regulatory T cells; MDSCs, myeloid-derived suppressor cells; TAMs-M2, M2-like macrophages; TAMs-M1, M1-like macrophages. Data were expressed as means ± SD (n = 3 biologically independent samples in b, d, f, g, h, j, and k). Statistical difference was calculated using two-tailed unpaired student’s t-test. *P < 0.05, **P < 0.01, ***P < 0.001. Source data are provided as a Source Data file.

