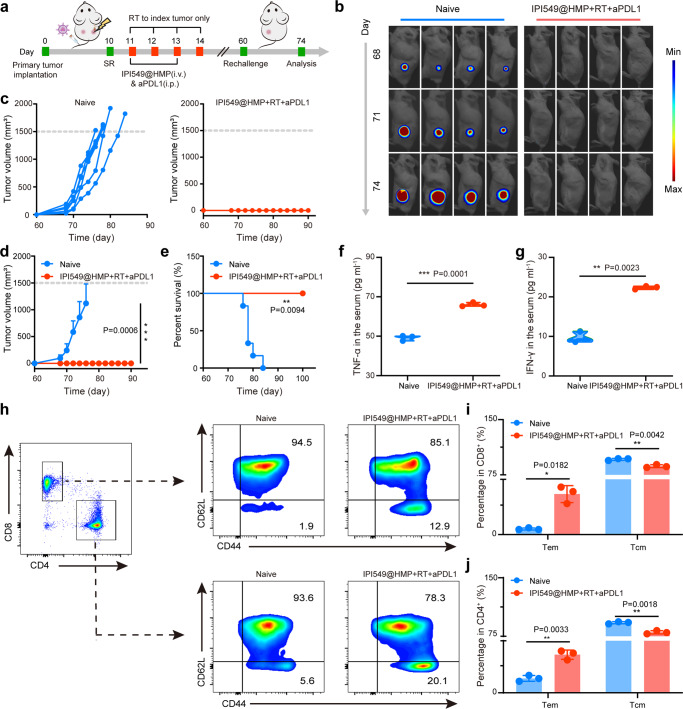
Fig. 8. Long-term immune memory effects.
a Schematic illustration of the experiment design to assess the immunological memory response triggered by IPI549@HMP-augmented RT and anti-PD-L1 combination therapy. b Representative bioluminescence images of Luc+ CT26 tumor of six biologically independent animals from each group after varied treatments as indicated. c–e Individual (c), average (d) tumor growth curves and survival curves (e) of the treated mice. Error bars are based on means ± SD (n = 6 mice in c–e). f, g Cytokine levels of TNF-α (f) and IFN-γ (g) in the serum after tumor rechallenging. h-j Representative flow cytometric analysis (h) and relative quantification of central memory T cell (Tcm, CD62L+CD44+) and effector memory T cell (Tem, CD62L-CD44+) subset from CD8+ (i) and CD4+ (j) T cells in the spleen. Data were expressed as means ± SD (n = 3 biologically independent samples in f, g, i and j). Statistical difference was calculated using two-tailed unpaired student’s t-test (d, f, g, i and j) and Log-rank (Mantel-Cox) test (e). *P < 0.05, **P < 0.01, ***P < 0.001. Source data are provided as a Source Data file.

