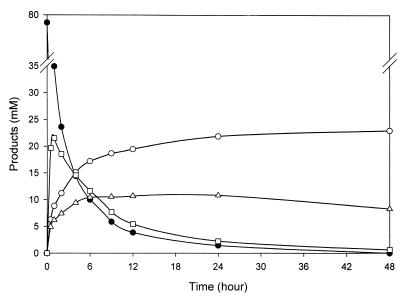
FIG. 8.
Time course analysis of acarbose transfer product formation. ThMA was reacted with acarbose (5% [wt/vol]) and α-MG (10% [wt/vol]) at 60°C for 48 h. The graph shows the hydrolysis of acarbose (black circles), formation of α-(1,4)-acarbose transfer product (squares), formation of α-(1,6)-acarbose transfer product (white circles), and formation of α-(1,3)-acarbose transfer product (triangles).

