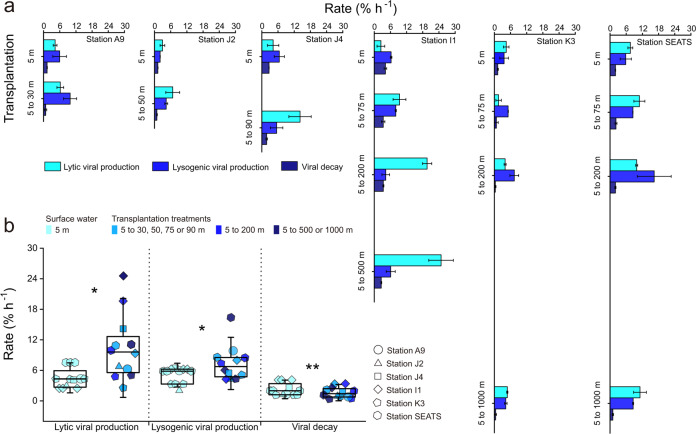
Fig. 2. Viral activity in the transplantation experiments.
a Lytic and lysogenic viral production and viral decay in control and transplantation experiments performed in six stations. Error bars indicate the standard errors calculated from duplicate sample measurements. b Comparison of lytic and lysogenic viral production and viral decay in transplantation experiments with control treatments. Error bars indicate the standard deviations calculated from all measurements in control or in transplantation experiments. ns, no significant difference; *p < 0.05; **p < 0.01.

