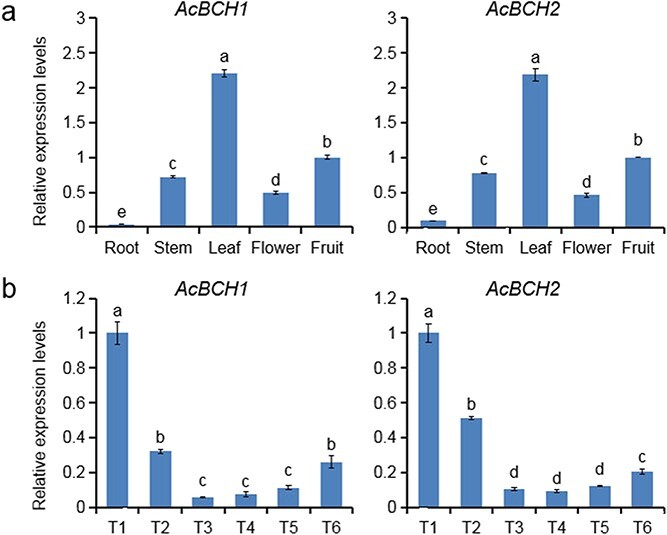
Figure 2.

Spatiotemporal expression pattern of AcBCH1/2. a Relative expression levels of AcBCH1/2 in different tissues of kiwifruit. b Relative expression levels of AcBCH1/2 in kiwifruit during fruit development. T1–T6 represent 30, 55, 70, 95, 130, and 145 days after 75% flower drop. Each value is expressed as mean ± standard deviation (n = 3). Different lower-case letters indicate significant differences at P < .05 level by Studentʼs t-test.
