
Figure 5.
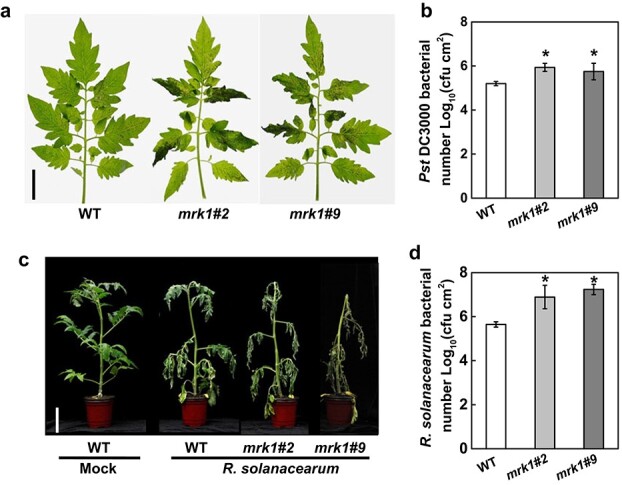
MRK1 positively regulates tomato disease resistance to P. syringae pv. tomato (Pst DC3000) and R. solanacearum pathogens. a Disease symptoms of mrk1 mutants and WT plants photographed at 5 days post inoculation (dpi) with Pst DC3000. Bars = 2 cm. b Pst DC3000 bacterial populations were assessed at 3 dpi. c The phenotypes of tomato plants at 10 dpi with R. solanacearum and R. solanacearum bacterial populations (d) in plants assessed at 10 dpi. Bars = 8 cm. An asterisk indicates a significant difference between treatments (P < 0.05, Tukey’s test). The results in b and d are presented as mean values ± SD; n = 5. These experiments were performed three times with similar results.