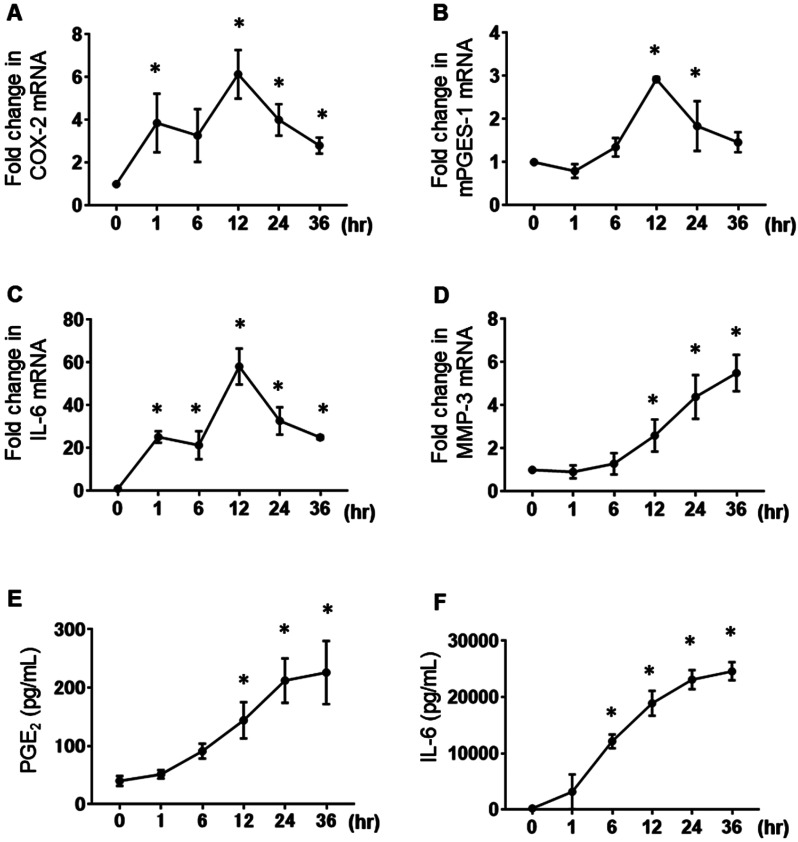
Fig. 1.
Effects of TNF-α on MH7A cells. MH7A cells were stimulated with 10 ng/mL TNF-α for 1, 6, 12, 24, or 36 h. The mRNA expression levels of COX-2 (A), mPGES-1 (B), IL-6 (C), and MMP-3 (D) were determined by real-time PCR. Data are presented as the mean ± SEM of three independent experiments (*P < 0.05 vs. 0 h). The PGE2 (E) and IL-6 (F) production levels in MH7A cells stimulated with 10 ng/mL TNF-α for 1, 6, 12, 24, or 36 h were determined using enzyme-linked immunosorbent assay. Data are expressed as the mean ± SD (n = 3; *P < 0.05 vs. 0 h).

