Fig. 3.
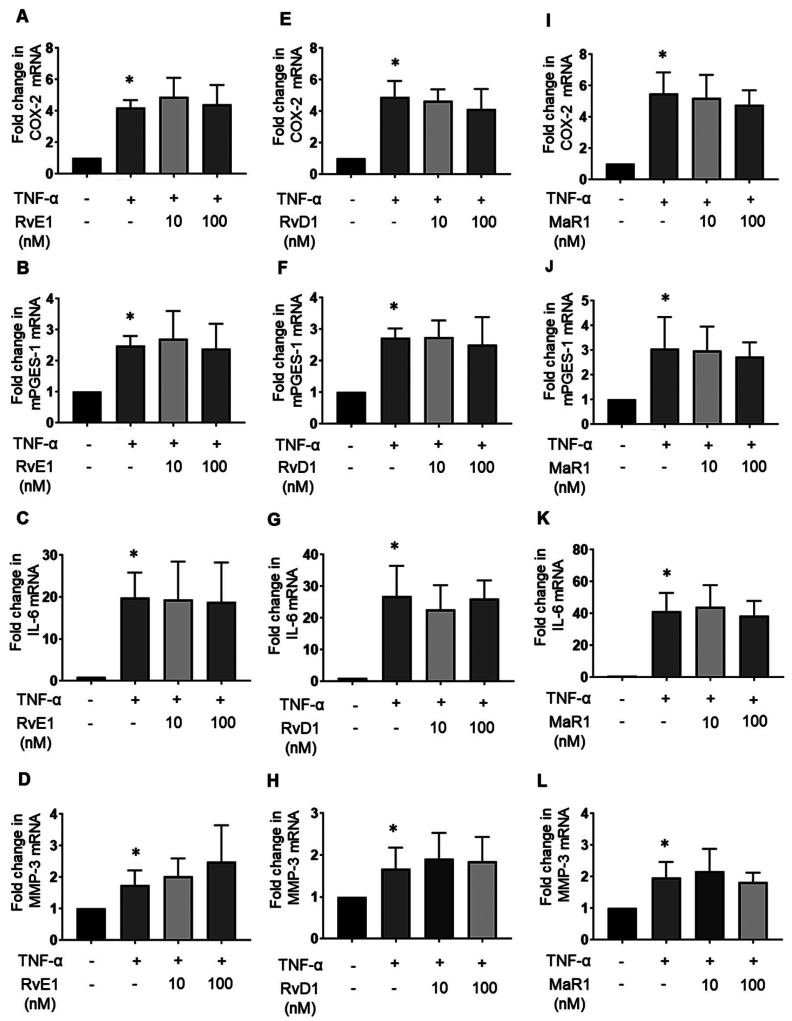
Effects of SPMs on TNF-α-treated MH7A cells. MH7A cells were cultured with or without 10 nM and 100 nM RvE1, RvD1, and maresin-1 (MaR1) in the presence of 10 ng/mL TNF-α for 12 h. The effects of RvE1 on the following substances were examined using real-time PCR: the mRNA expression levels of COX-2 (A), mPGES-1 (B), IL-6 (C), and MMP-3 (D) or RvD1 on COX-2 (E), mPGES-1 (F), IL-6 (G), and MMP-3 (H) or MaR1 on COX-2 (I), mPGES-1 (J) and IL-6 (K), and MMP-3 (L). The plots represent three independent experiments. Data are presented as the mean ± SEM of three independent experiments (*P < 0.05 vs. untreated).

