Figure 1.
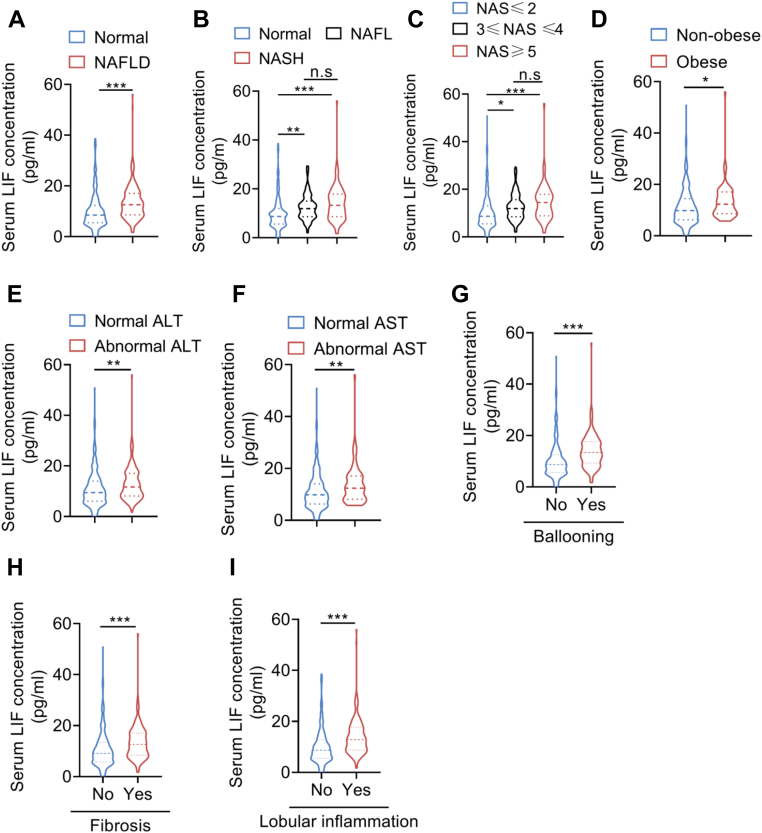
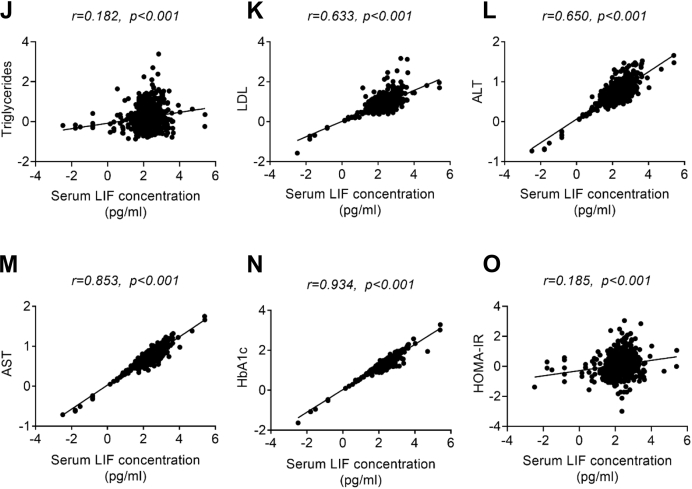
Serum LIF levels are elevated in patients with NAFLD/NASH.A, serum LIF concentration in normal subjects (n = 314) and NAFLD subjects (n = 214). B, serum LIF concentration in normal subjects (n = 314), NAFL subjects (n = 107), and NASH subjects (n = 107). C, comparison of serum LIF levels in patients with NAFLD with different grades (NAS≤2 [n = 338], 3≤NAS≤4 [n = 122], NAS≥5 [n = 68]). D, serum LIF concentration in nonobese subjects (n = 457) and obese subjects (n = 71). E, serum LIF levels in subjects with (n = 401) and without (n = 127) normal ALT. F, serum LIF levels in subjects with (n = 459) and without (n = 69) normal AST. G, concentration of serum LIF in subjects with the presence (n = 361) or absence (n = 167) of ballooning. H, concentration of serum LIF in subjects with the presence (n = 387) or absence (n = 141) of fibrosis. I, concentration of serum LIF in subjects with the presence (n = 345) or absence (n = 183) of lobular inflammation. J–O, association between serum LIF concentration and triglycerides, LDL, ALT, AST, HbA1c, and HOMA-IR (n = 528). ∗p < 0.05, ∗∗p < 0.01, ∗∗∗ p < 0.001. For I–N, spearman correlation analysis was used. ALT, alanine transaminase; AST, aspartate aminotransferase; HbA1c, glycated hemoglobin; HOMA-IR, homeostasis model assessment of insulin resistance; LDL, low-density lipoprotein; LIF, leukemia inhibitory factor; NAFL, nonalcoholic fatty liver; NAFLD, nonalcoholic fatty liver disease; NAS, NAFLD activity score; NASH, nonalcoholic steatohepatitis.


