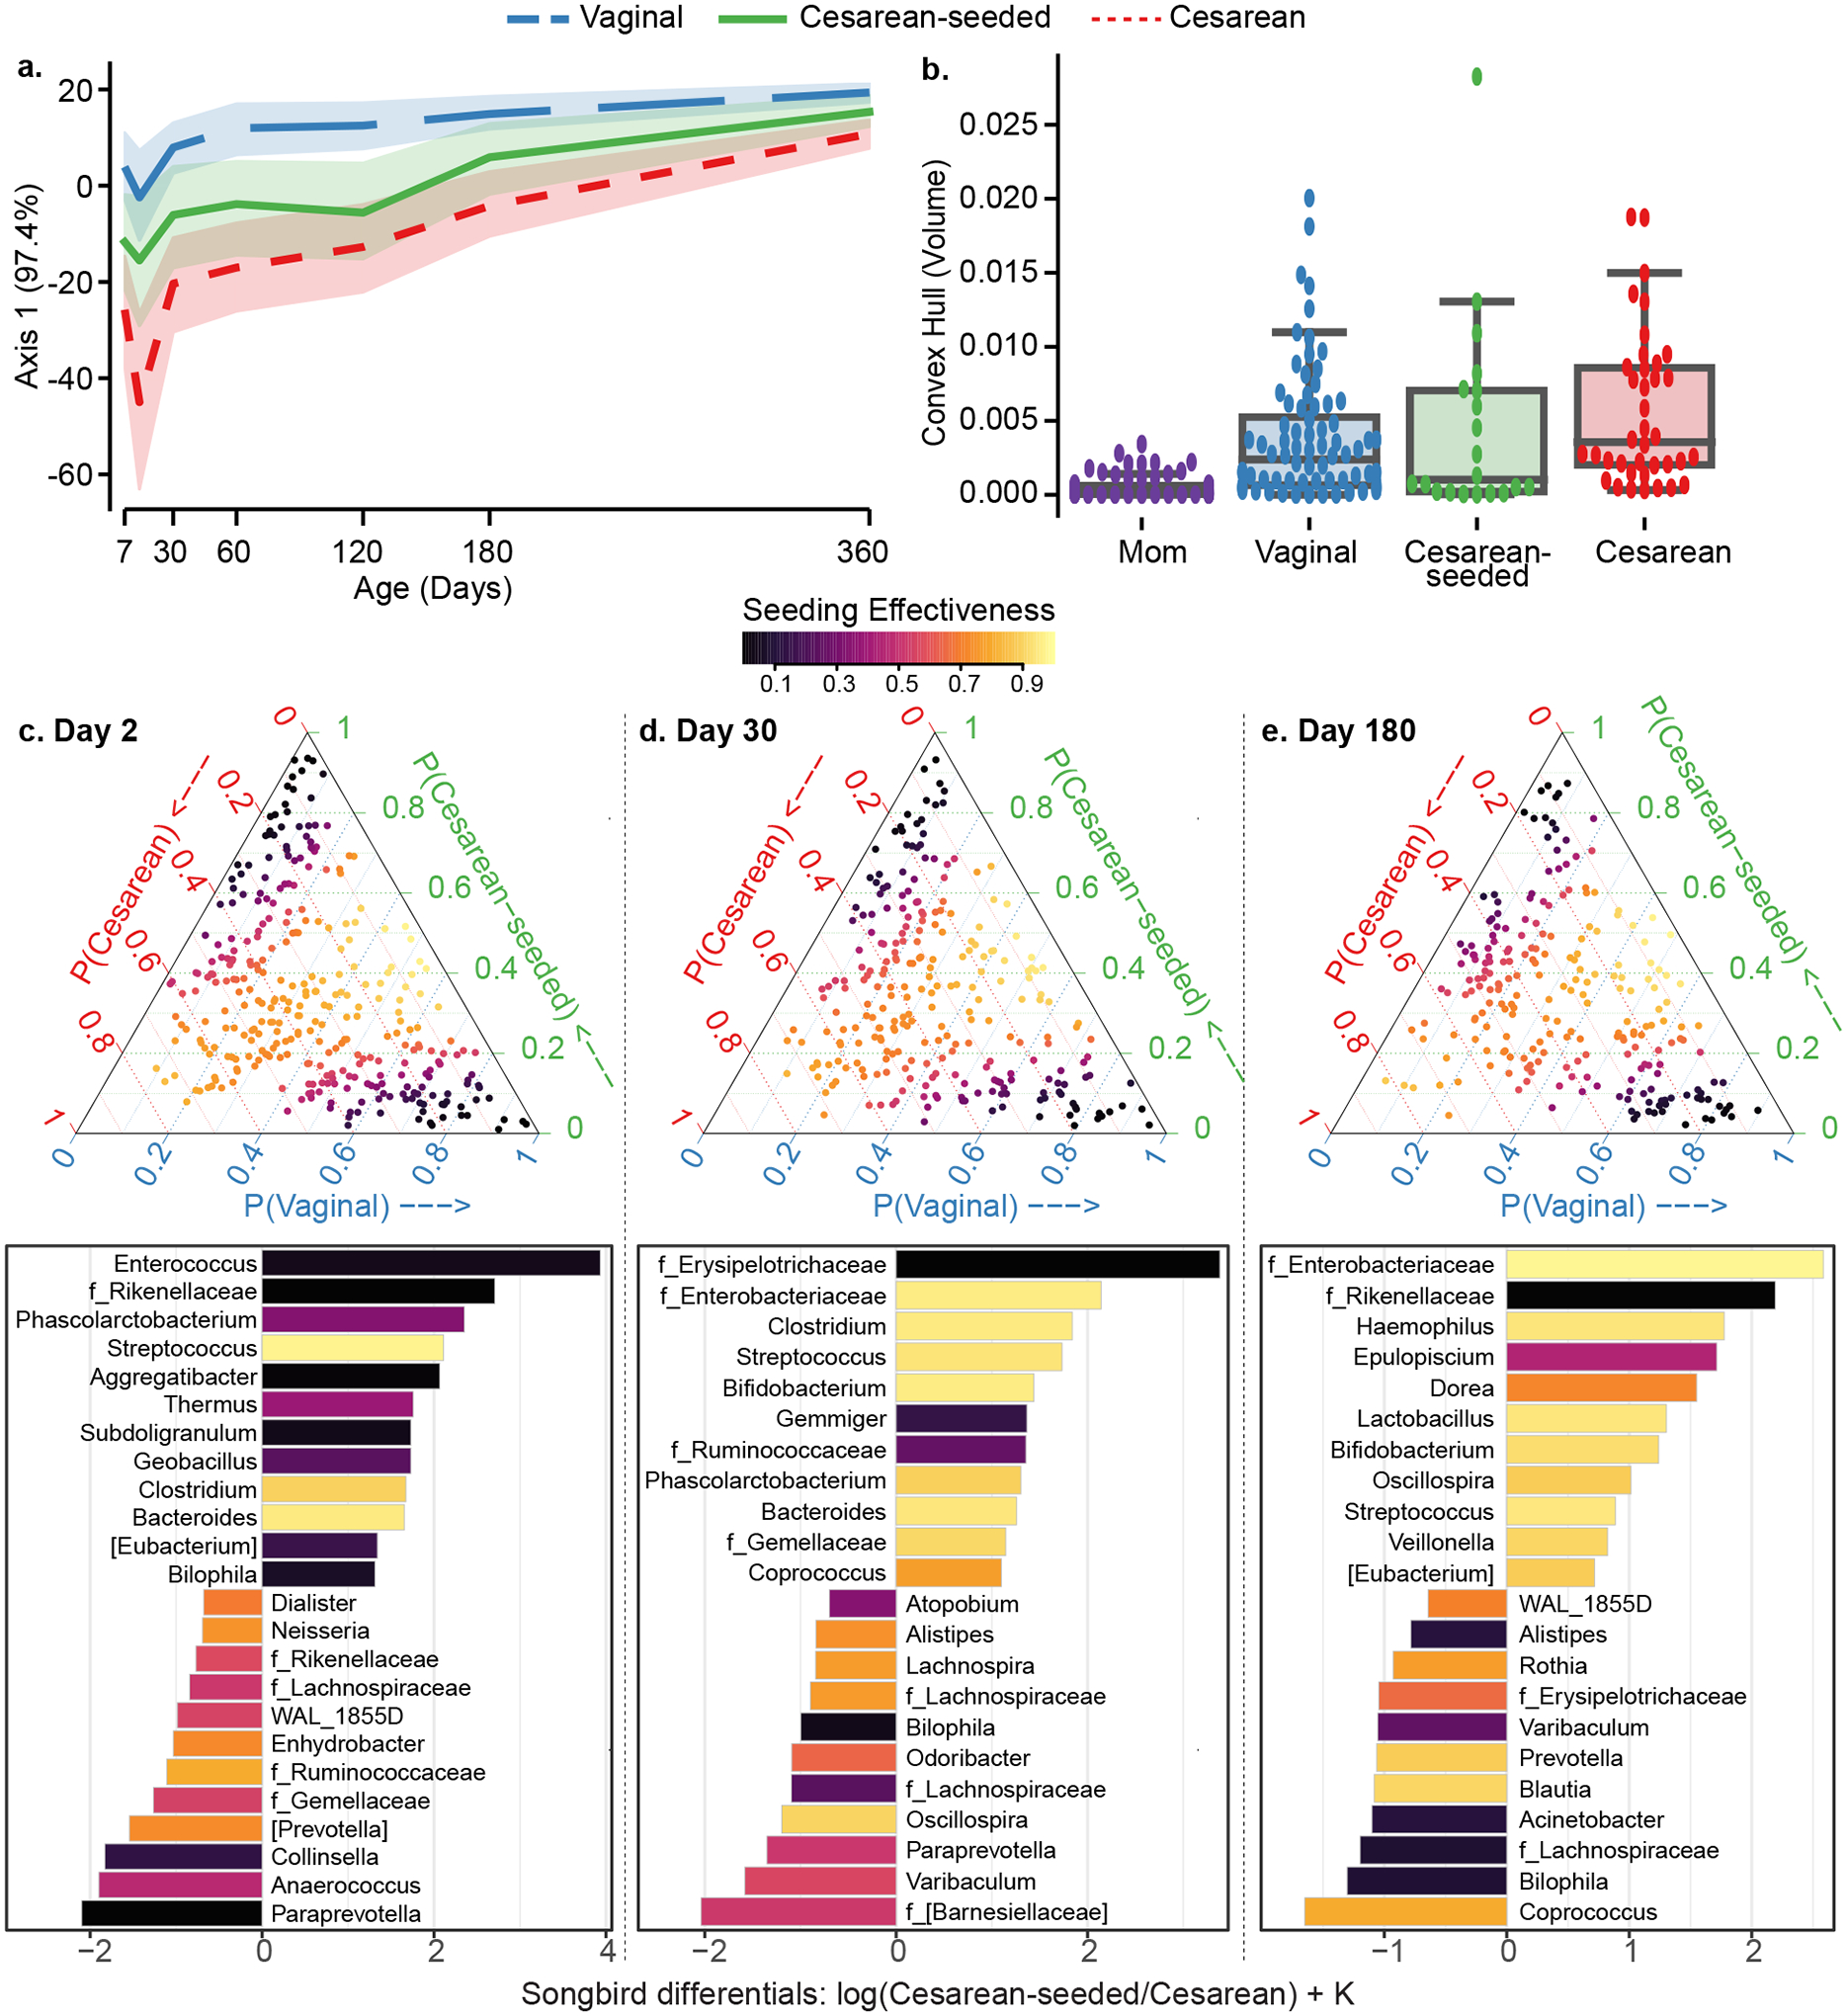
Figure 1. Fecal microbiota development during the first year of life in babies discordant to birth mode/exposure.

(a) Compositional Tensor Factorization (CTF) first principal component (Y-axis) of infant samples over age in days (X-axis). (b) Convex hull volume (Y-axis) on the first three Principal Coordinates (unweighted UniFrac distances) in mothers (purple) and infants by birth mode or exposure (X-axis). Infants show highest volumes in Cesarean born and lowest in Vaginally born, with Cesarean-seeded babies showing intermediate volumes; all pairwise comparisons are significant using Mann-Whitney test with Bonferroni corrections at 0.05 level (Table S3). (c-e) Songbird differentials shown for day 2, 30, and 180 after birth; ternary plots of the inverse additive log-ratio transform (inverse-ALR) of Songbird differentials give the estimated probability of a microbe being observed in Cesarean (left-axes; red), Vaginal (bottom-axes; blue), or Cesarean-seeded (right-axes; green). The color of the dots depicts the seeding effectiveness, with yellow color indicating effectively seeded/suppressed and black indicating not effectively seeded. Below each triangle, bar plots of top and bottom 20% Songbird differentials summarized at genus-level taxa between Cesarean-seeded and Cesarean born babies; a positive value indicates higher association with the Cesarean-seeded group, a negative value indicates higher with Cesarean. Bars are colored by the ASVs’ seeding effectiveness. The majority of taxa discordant overrepresented in the Cesarean-seeded group over the Cesarean group are yellow-orange, indicating ASVs effectively seeded in the Cesarean seeded group, and these are observed at all ages.
See also Figure S4, Supplementary Methods S2–S7.
