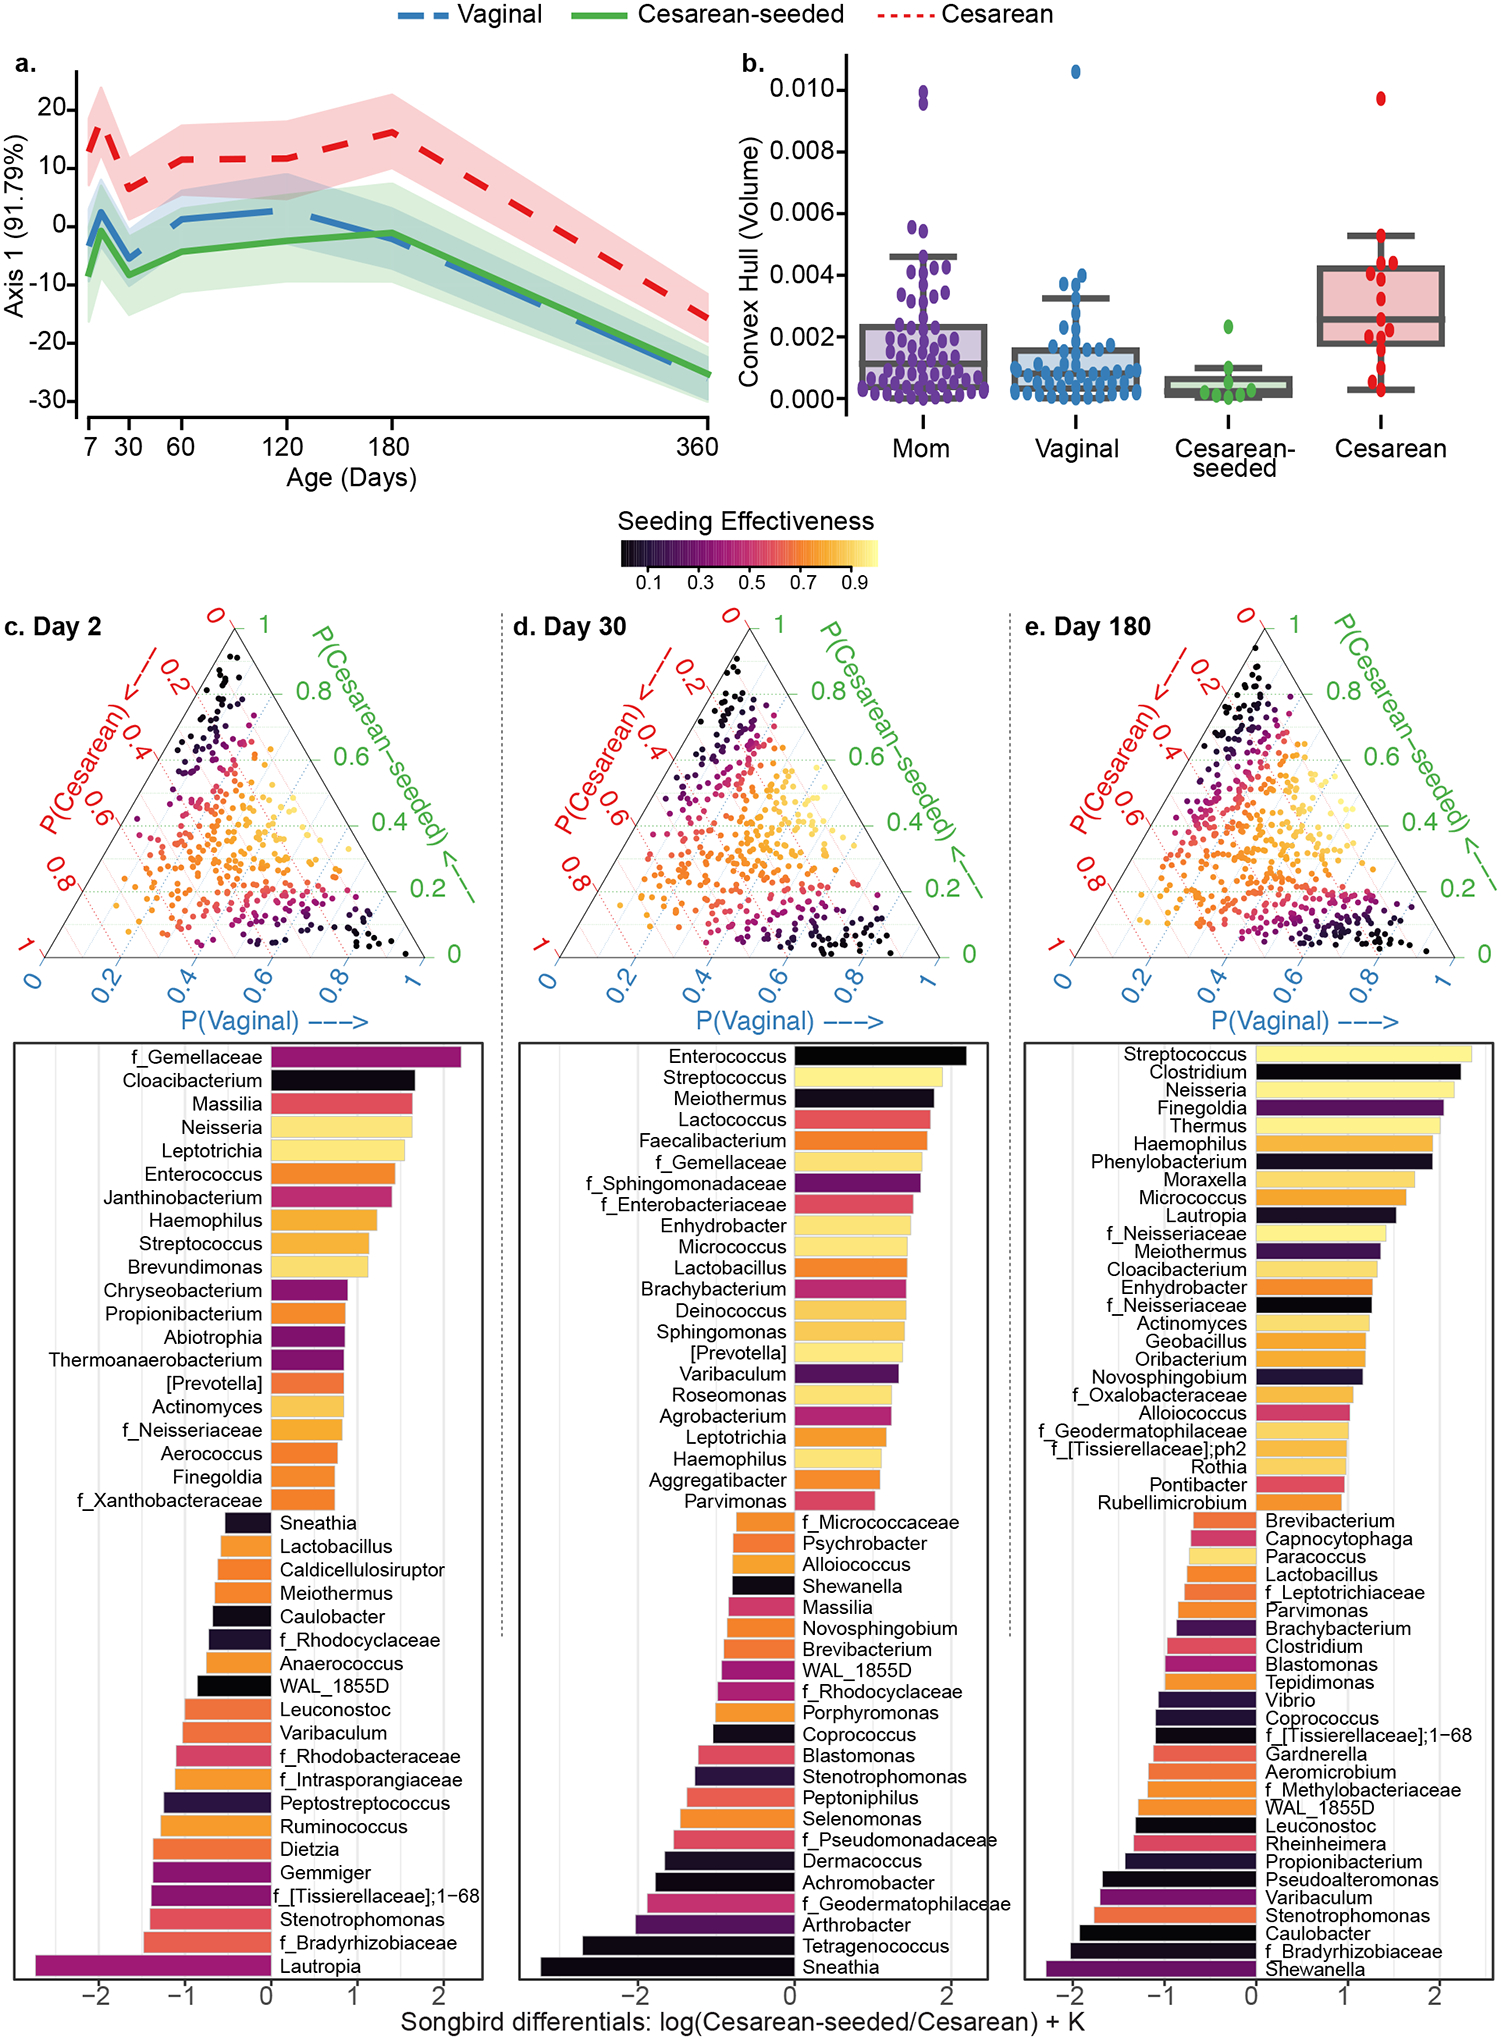
Figure 3. Skin microbiota development during the first year of life in babies discordant to birth mode/exposure.

(a) Compositional Tensor Factorization (CTF) first principal component (Y-axis) of infant samples over age in days (X-axis). (b) Convex hull volume (Y-axis) on the first three Principal Coordinates (unweighted UniFrac distances) in mothers (purple) and infants by birth mode or exposure (X-axis). Infants show highest volumes in Cesarean born and lowest in Vaginally born, with Cesarean-seeded babies showing intermediate volumes; all but one pairwise comparison are significant using Mann-Whitney test with Bonferroni corrections at 0.05 level (Table S3). (c-e) Songbird differentials shown for day 2, 30, and 180 after birth; ternary plots of the inverse additive log-ratio transform (inverse-ALR) of Songbird differentials give the estimated probability of a microbe being observed in Cesarean (left-axes; red), Vaginal (bottom-axes; blue), or Cesarean-seeded (right-axes; green). The color of the dots depicts the seeding effectiveness, with yellow color indicating effectively seeded/suppressed and black indicating not effectively seeded. Below each triangle, bar plots of top and bottom 20% Songbird differentials summarized at genus-level taxa between Cesarean-seeded and Cesarean born babies; a positive value indicates higher association with the Cesarean-seeded group, a negative value indicates higher with Cesarean. Bars are colored by the ASVs’ seeding effectiveness. The majority of taxa discordant overrepresented in the Cesarean-seeded group over the Cesarean group are yellow–orange, indicating ASVs effectively seeded in the Cesarean seeded group, and these are observed at all ages. See also Figure S4, Supplementary Methods S2–S7.
