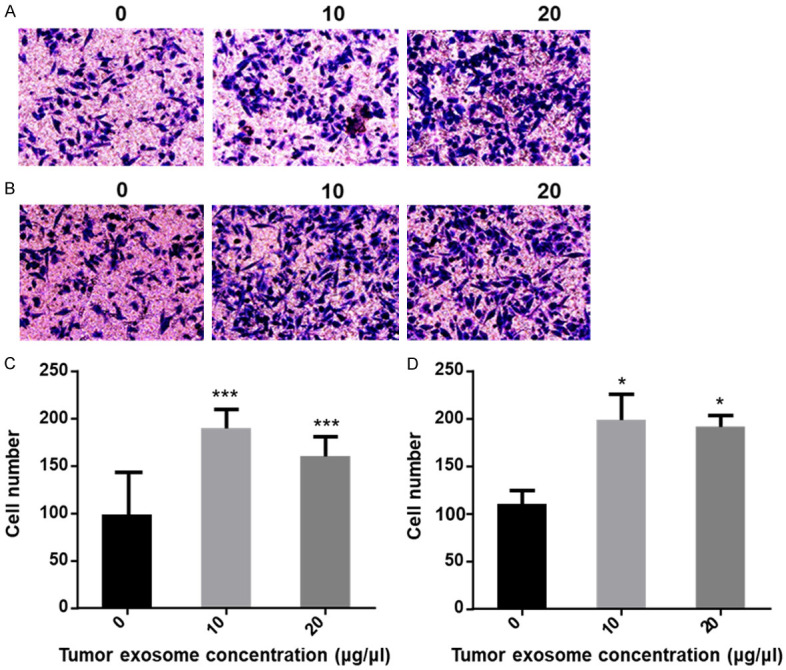
Figure 10.

Different concentration of tumor exosome increases the migration and invasion in HepG2 cells. (A) Image of migratory cells; (B) Image of invasion cells. The images were taken via fluorescence microscopy. Magnification, ×200; (C) Error bars represent the standard deviation of three independent experiments. ***P < 0.001 compared to the control of the migratory cells; (D) Error bars represent standard deviation of three independent experiments. *P < 0.05 compared to the control of invasion cells.
