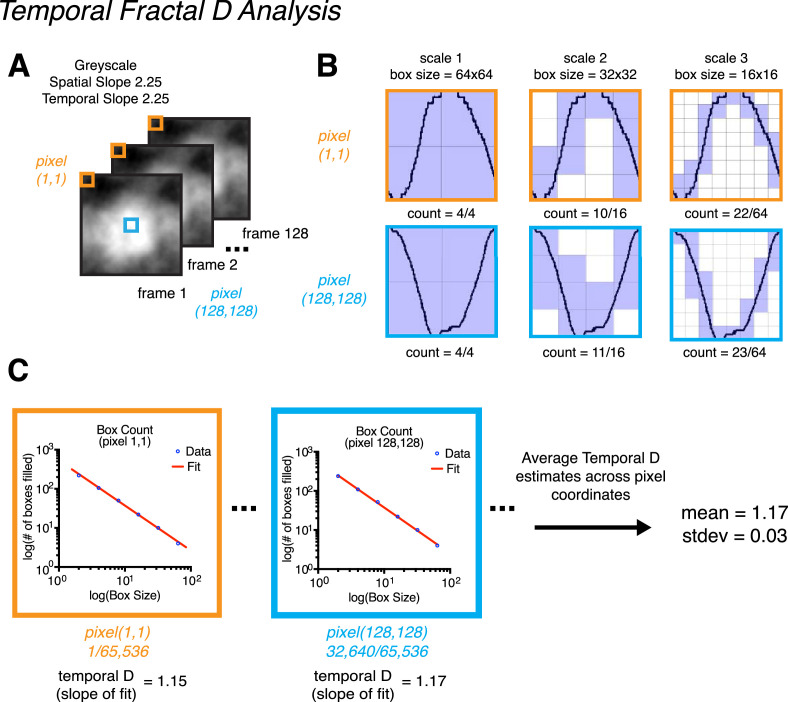
Figure 4.
Demonstration of how temporal fractal D is calculated using stimulus condition gray scale spatial slope of 2.25 and a temporal slope of 2.25. (A) Depiction of an example stimulus, and two example pixel coordinates across frames: pixel (1, 1) in orange and pixel (256, 256) in blue. The temporal fractal D values we report were calculated by averaging across temporal fractal D estimates made for each pixel coordinate within each stimulus. Specifically, for each pixel coordinate (256 × 256 = 65,536 coordinates total) we plotted luminance as a function of time (frames) and conducted a box-counting procedure on each plot. (B) The box-counting procedure consisted of overlaying each plot with a mesh grid of equally sized boxes. As in our spatial fractal D procedure, boxes that contained pixel values 0 and 1 were counted as occupied. This procedure was conducted across multiple spatial scales, and the maximum number of scales analyzed was equal to maximum number of times the image size could be divided by 2, with the smallest box size being 2. For stimuli in the present study, six scales were counted (128 frames -> 64, 32, 16, 8, 4, 2). Only three scales for pixel (1, 1) and pixel (128, 128) are depicted for brevity. (C) After box counting, temporal fractal D was calculated for each pixel coordinate by fitting the slope of the relationship between box size and box occupancy a log–log axis. The final reported temporal fractal D value is the average across all pixel coordinates.

